
Fig. 4.
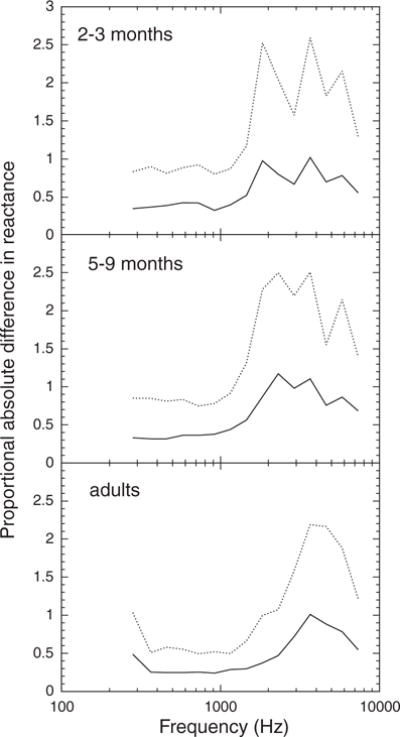
Absolute test–retest difference in reactance, expressed as a proportion of mean reactance, as a function of frequency for three age groups. The solid line represents the mean value and the dashed line represents the 90th percentile value.
Official websites use .gov
A
.gov website belongs to an official
government organization in the United States.
Secure .gov websites use HTTPS
A lock (
) or https:// means you've safely
connected to the .gov website. Share sensitive
information only on official, secure websites.
Absolute test–retest difference in reactance, expressed as a proportion of mean reactance, as a function of frequency for three age groups. The solid line represents the mean value and the dashed line represents the 90th percentile value.