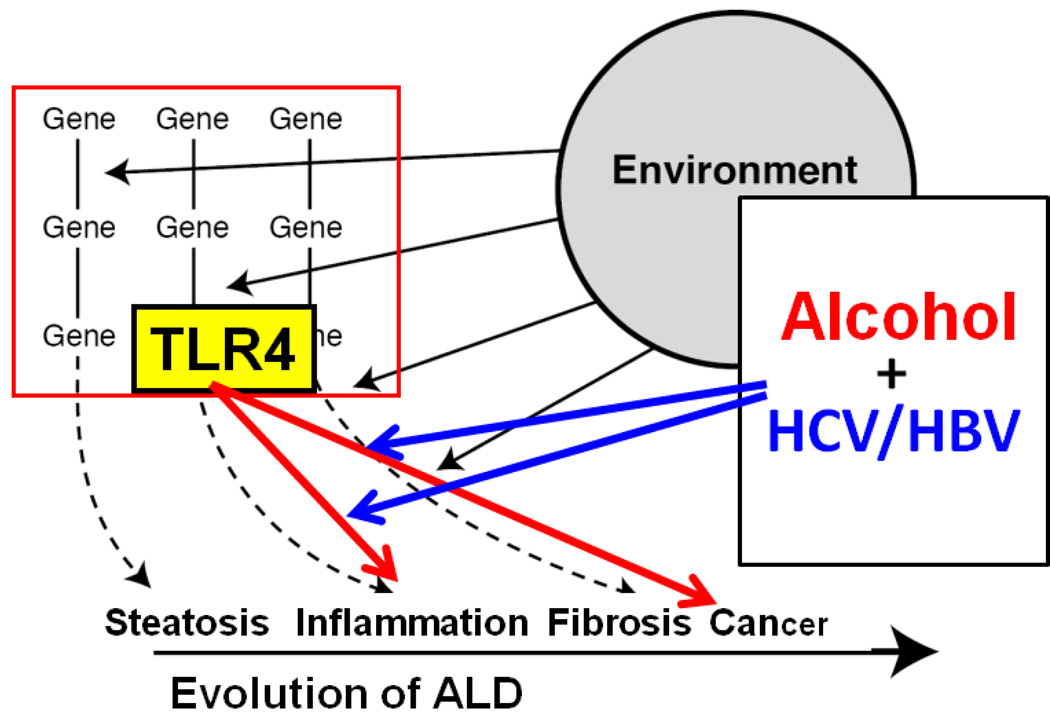
Figure 1.
This schematic diagram depicts that alcohol and HCV interact to render synergistic effects on the evolution of alcoholic liver disease that is governed by gene-environment interactions (dotted arrows and solid black lines). TLR4 mediates promotion of liver inflammation and cancer as depicted by red arrows and alcohol and HCV facilitate these TLR4-dependent mechanisms as shown by blue arrows.

