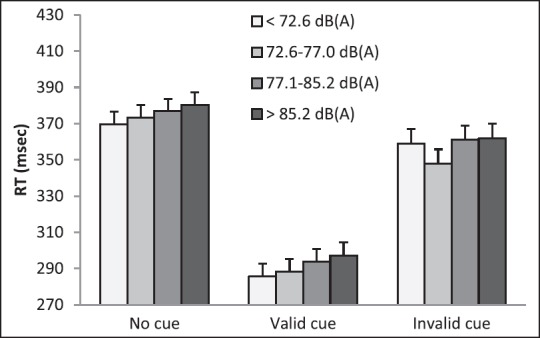
Figure 2.

Mean response time (RT) adjusted for percentage of errors and presented with SEM, for different stimuli presentations (no cue, valid cue, and invalid cue) among personnel on board Navy vessels exposed to different equivalent noise levels (in quartiles) measured before the cognitive performance test
