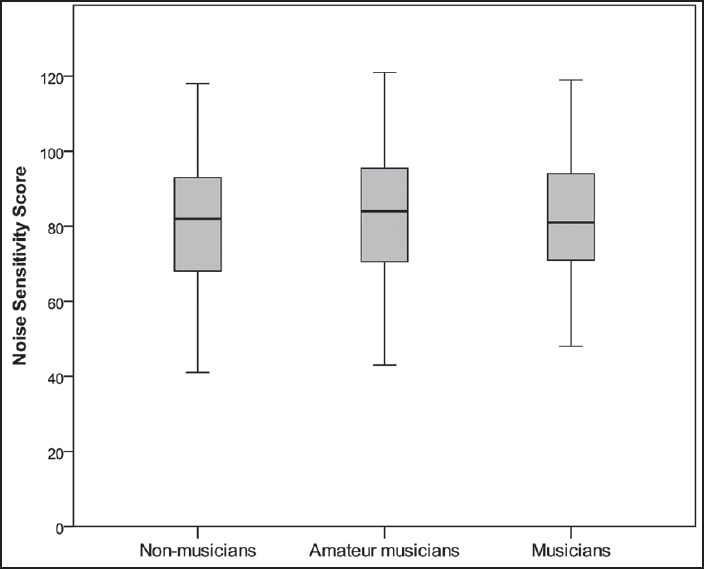
Figure 2.

Histogram showing the means (bars stand for standard deviation) of noise sensitivity scores in nonmusicians, amateur musicians, and musicians

Histogram showing the means (bars stand for standard deviation) of noise sensitivity scores in nonmusicians, amateur musicians, and musicians