Figure 3.

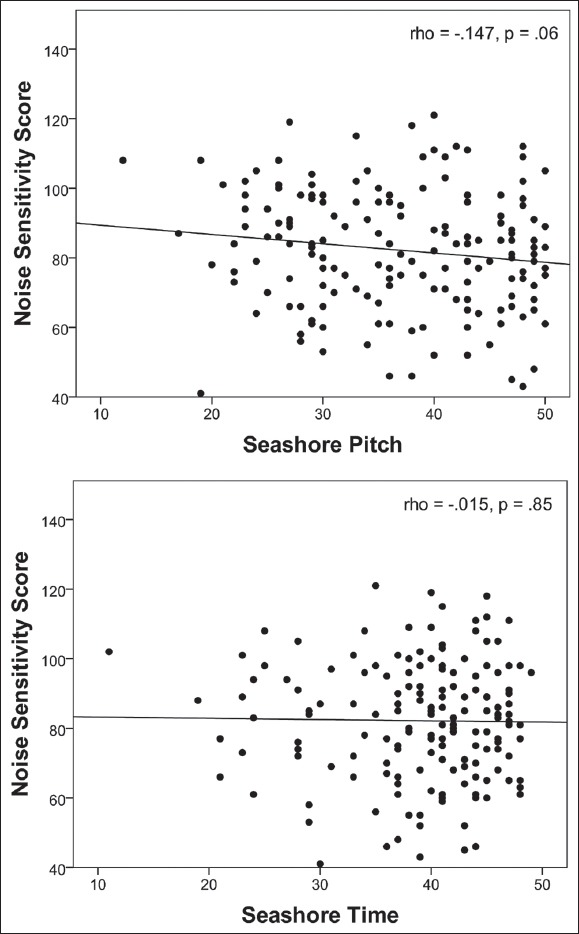
Scatterplots representing the relationship between noise sensitivity and performance in the Seashore test for pitch and time

Scatterplots representing the relationship between noise sensitivity and performance in the Seashore test for pitch and time