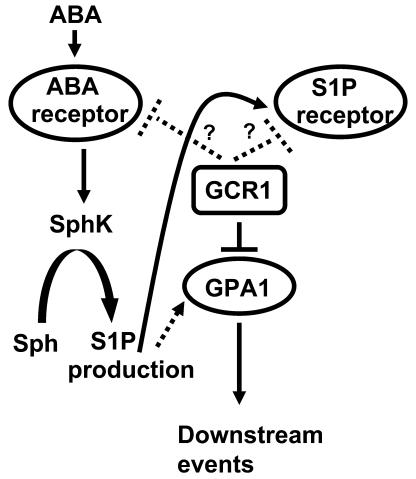
Figure 13.
Proposed Model for Interaction among GPA1, GCR1, and Possible ABA and S1P Receptors.
Solid lines indicate interactions confirmed by biochemical assays. Dotted lines indicate interaction implicated by genetic analyses. Question marks indicate hypothetical interactions consistent with current experimental data.

