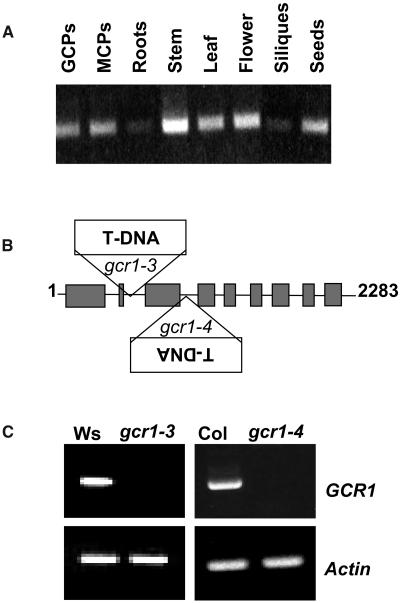
Figure 5.
GCR1 Expression and Isolation of gcr1 Insertion Mutants.
(A) RT-PCR profiling of GCR1 expression. GCPs, guard cell protoplasts; MCPs, mesophyll cell protoplasts.
(B) T-DNA insertion sites in gcr1-3 (Ws ecotype; Wisconsin collection) and gcr1-4 (Col ecotype; Syngenta). Boxes and lines represent exons and introns, respectively (figure not drawn to the scale).
(C) RT-PCR analysis of GCR1 expression in wild-type Ws and Col and gcr1 homozygous mutant lines using primers flanking the T-DNA insertion sites. Actin primers served as control.

