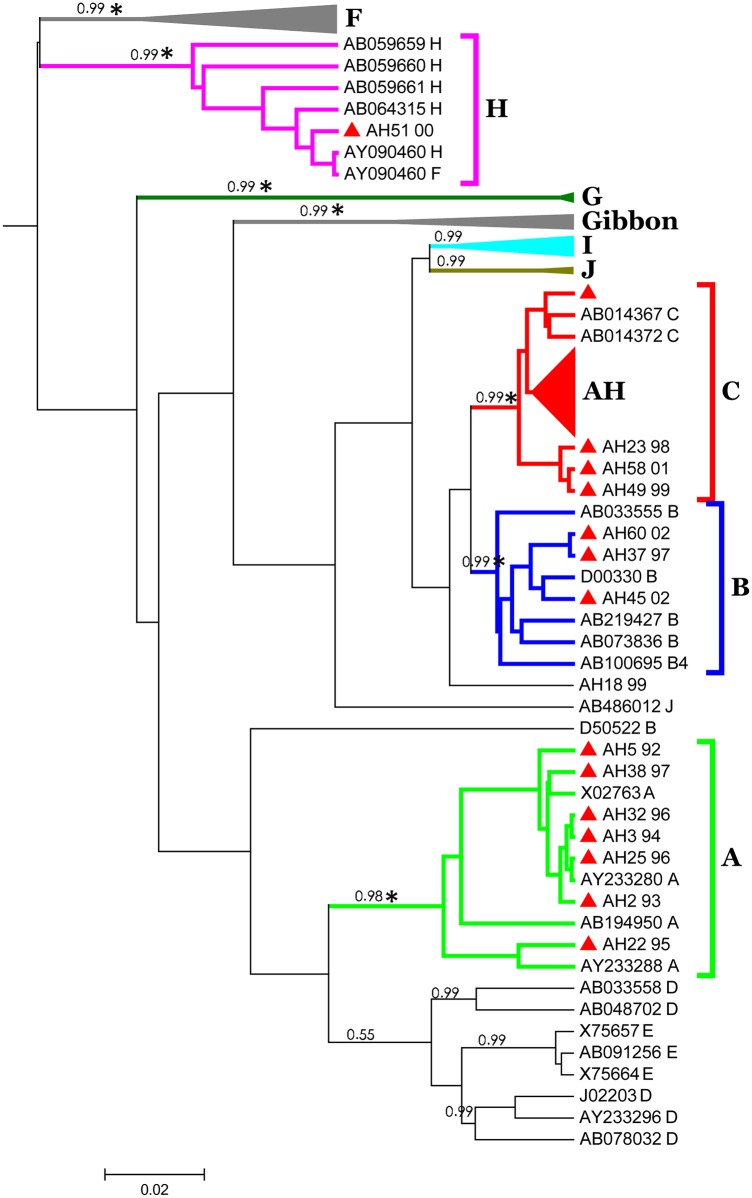
Fig 2. Phylogenetic tree of HBV C gene reconstructed by Bayesian inference.
The posterior probabilities higher than 0.95 and the star (* = bootstrap value great than 75) on the branches indicate a significant cluster. Red triangles present samples obtained from Japan (n = 48) were divided into genotype A, B, C and H.

