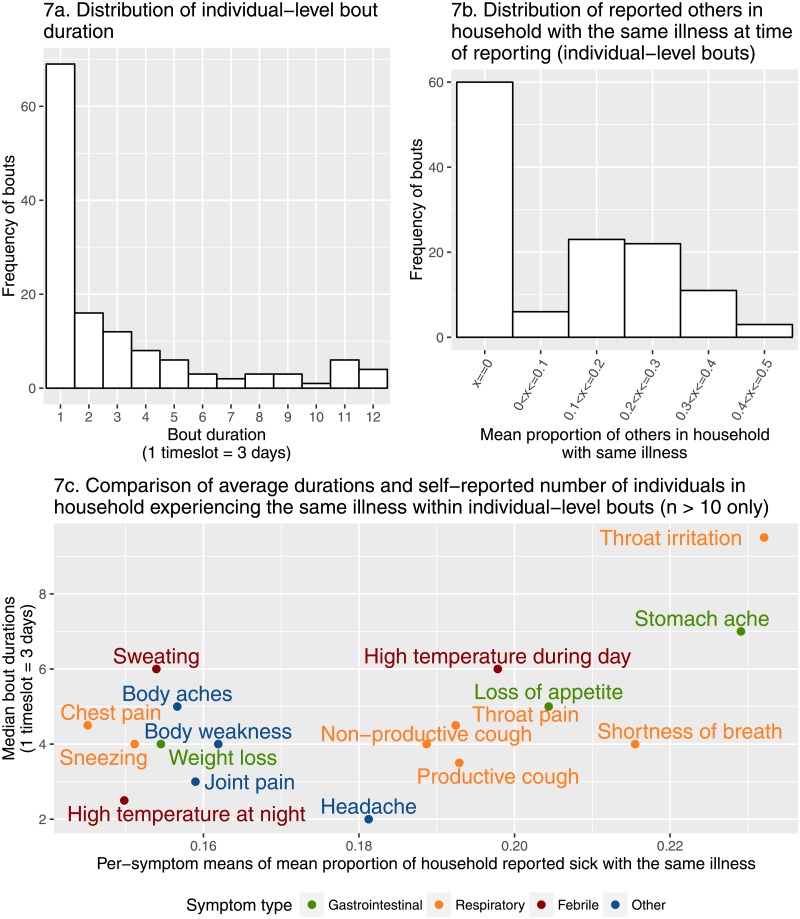
Fig 7. Between-bout comparisons.
Distributions of bout duration (7a) and the number of others reported to be sick with the same illness (7b) during bouts of illness. Also, comparison of the means of summary statistics obtained by aggregating all bouts containing at least one mention of a given symptom—median bout duration, and mean proportion of others sick (7c). This proportion was calculated using the number of individuals living in the household, which was recorded as part of the consent/assent process, and the distribution of which can be seen in S2 Fig.

