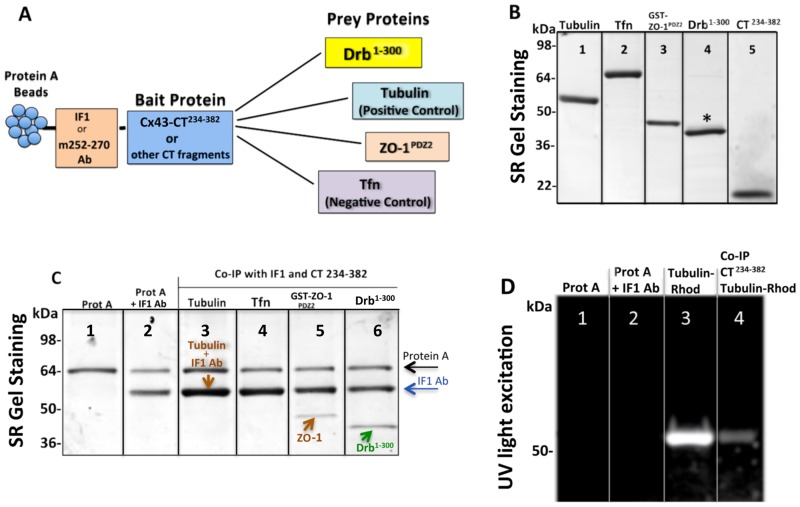
Fig 3. Connexin43 C-terminal region 234–283 contains binding sites for tubulin, drebrin and the PDZ2 domain of ZO-1.
(A) Schematic of the co-IP strategy used to observe and quantify the binding of Drb1-300 to the Cx43-CT, using the latter as a “bait” and the other proteins (including positive and negative controls) as “prey”. (B) SDS-PAGE gel stained by SR showing the purity and expected molecular weight at: 55 kDa for tubulin, 80 kDa for transferrin (Tfn), ~43 kDa for GST-ZO-1PDZ2 tag, ~40 kDa for Drb1-300, and ~19.6 kDa for CT234-382. The asterisk above the Drb1-300 band points out Drb1-300 extra bands. (C) SDS-PAGE gel stained by SR after co-IP (representative lanes chosen as best example from four independent experiments) utilizing IF1 antibody and Cx43-CT234-382 as “bait”. Arrows indicate the protein A (black), IF1 heavy chain (blue), ZO-1 or tubulin (brown), and Drb1-300 (green). Note that in the co-IP with tubulin, the heavy chain of IF1 and tubulin bands overlap. (D) Unstained SDS-PAGE gel imaged by UV to detect tubulin-rhodamine after co-IP with Cx43-CT. Lanes 1 and 2 show the absence of non-specific binding of tubulin-rhodamine to protein A and the IF1 antibody respectively, and lane 3 shows the pure tubulin-rhodamine signal.

