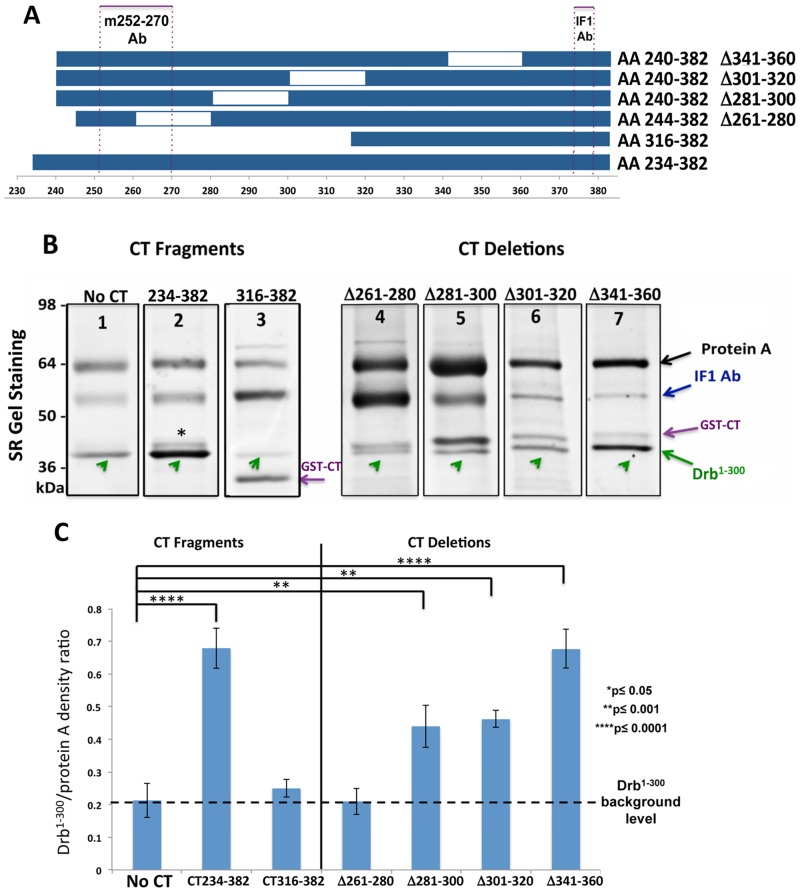
Fig 4. Co-IP reveals the Cx43-CT binding site for Drb1-300.
(A) Schematic representation of the Cx43-CT constructs used to delineate the minimal domain(s) interacting with Drb1-300 by co-IP. IF1 and m252-270 antibody epitopes are represented by purple dotted boxes. (B) SDS-PAGE gel stained by SR after co-IP (representative lanes chosen as best example from four independent experiments). Arrows indicate the migration bands of protein A (black), the heavy chain of IF1 (blue), GST-CT constructs (purple), and Drb1-300 (green). The asterisk points out Drb1-300 extra bands. (C) Quantification of the data shown in (B). Drb1-300 co-IP band intensities were normalized to the intensity of the protein A band. The dashed black line indicates the Drb1-300 background level, providing the non-specific binding value. P values obtained through T-test are indicated. Error bars represent the standard deviation between four replicates.

