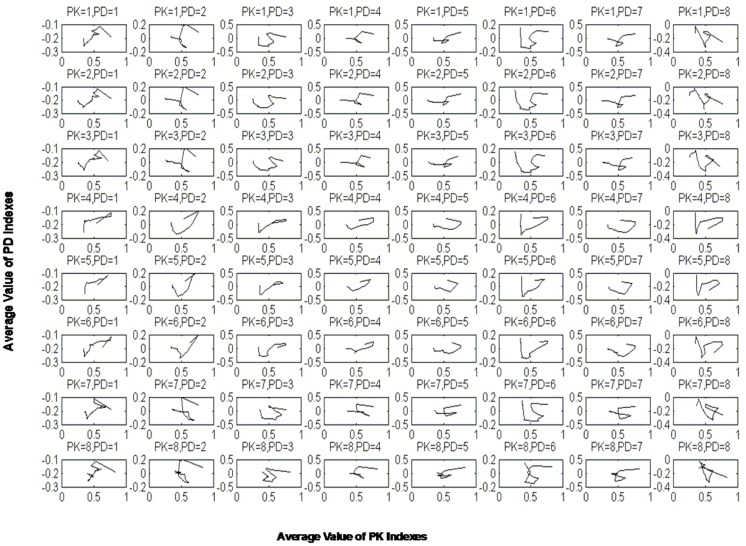
Fig 6. The relationship between pharmacokinetics and pharmacodynamics.
Each subgraphic represents the change in the trend of a PD index along with a PK index; PK indexes 1–8 represent baicalin, oroxylin A-7-O-glucuronide, wogonoside, geniposide, magnolflorine, berberine, wogonin and oroxylin A, respectively; PD indexes 1–8 represent IL-6, IFN-γ, IL-1β, MIP-2, TNF-α, IL-13, IL-10 and the body temperature of rats, respectively.

