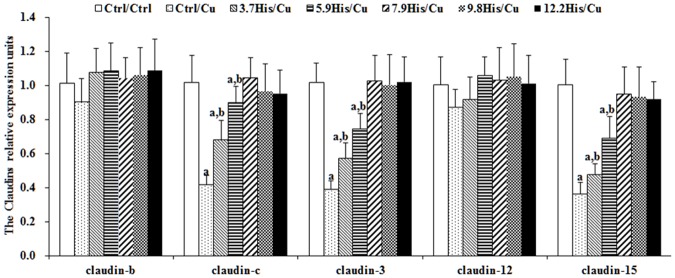
Fig 3. The claudin mRNA levels in the entire intestine as a function of histidine.
Young grass carps were fed for 8 weeks with diets with different doses of histidine, and then exposed to 0.7 mg Cu/L water for 4 additional days. Values are expressed as the mean with standard deviation and are represented by vertical bars (n = 6). Superscript (a) indicates a significant (P < 0.05) difference over Ctrl/Ctrl values. Superscript (a,b) indicates a significant (P < 0.05) difference over Ctrl/Ctrl and Ctrl/Cu values.

