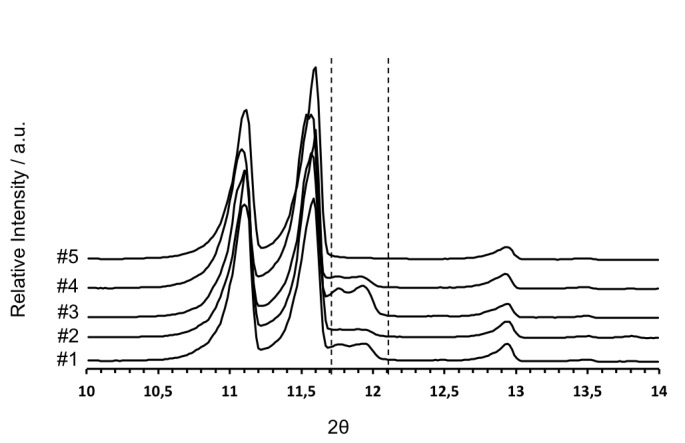
Fig. S4.

XRPD diffractograms, at slow scan, correspondent to the spray-congealed 1:1 CAF:GLU cocrystals produced in [1]: #1 to #5 – different tests performed according to the experimental design. The dashed lines represent the integration interval (i.e. 11.7–12.1 2θ).
