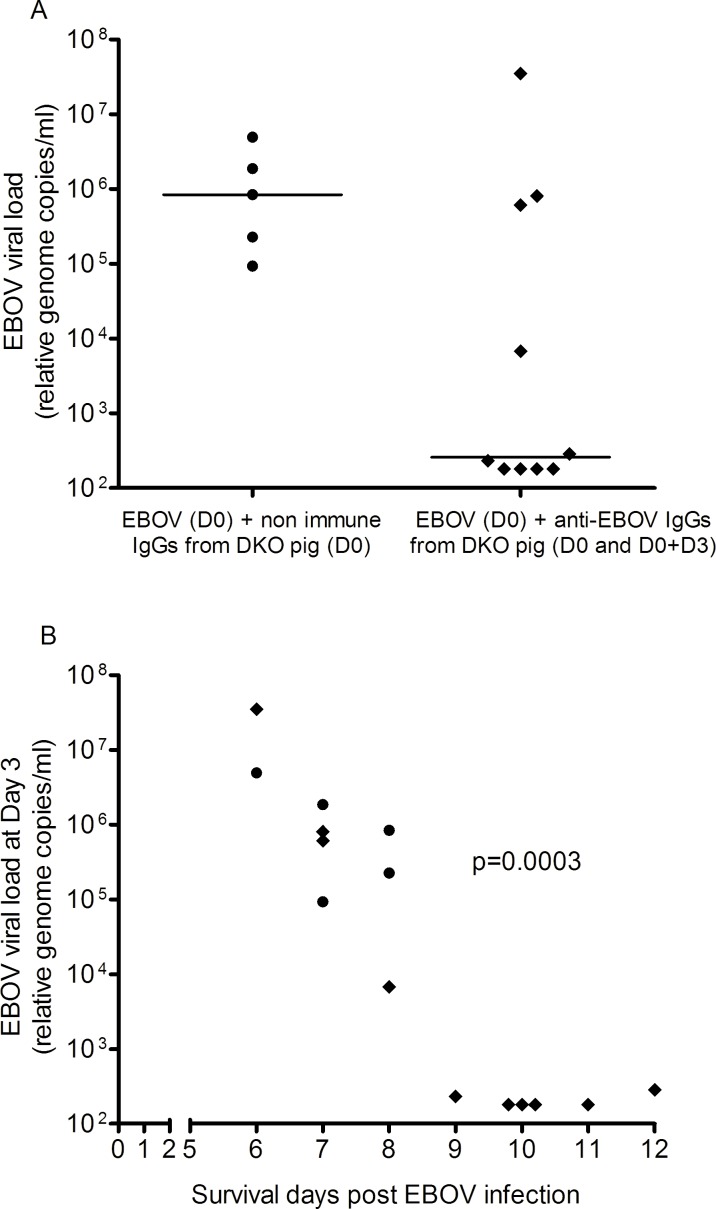
Fig 4. Viral loads in serum at day 3 post-EBOV infection.
A: Levels of circulating EBOV transcripts at day 3 post infection in the serum of each animal was evaluated by RT-qPCR using primers targeting EBOV polymerase gene. The horizontal bars represent the median values. The median D3 virus load was 839,333 following the injection of non-immune IgGs from a DKO pig and 259 following the injection of anti-EBOV antibodies (p = 0.055, using a Mann-Whitney test). The limit of detection of the test was of 180 relative genome copies/ml, and all values under this threshold were considered as negative data (as represented on the graph). B: Correlation between viral load on day 3 and guinea pig survival. Kendall's rank correlation coefficient showed a significant negative correlation (p = 0.0003) between EBOV viral load at day 3 and survival following infection, when considering all pooled data. Non-treated animal’s values are displayed as circles whereas treated animal’s values are displayed as squares.

