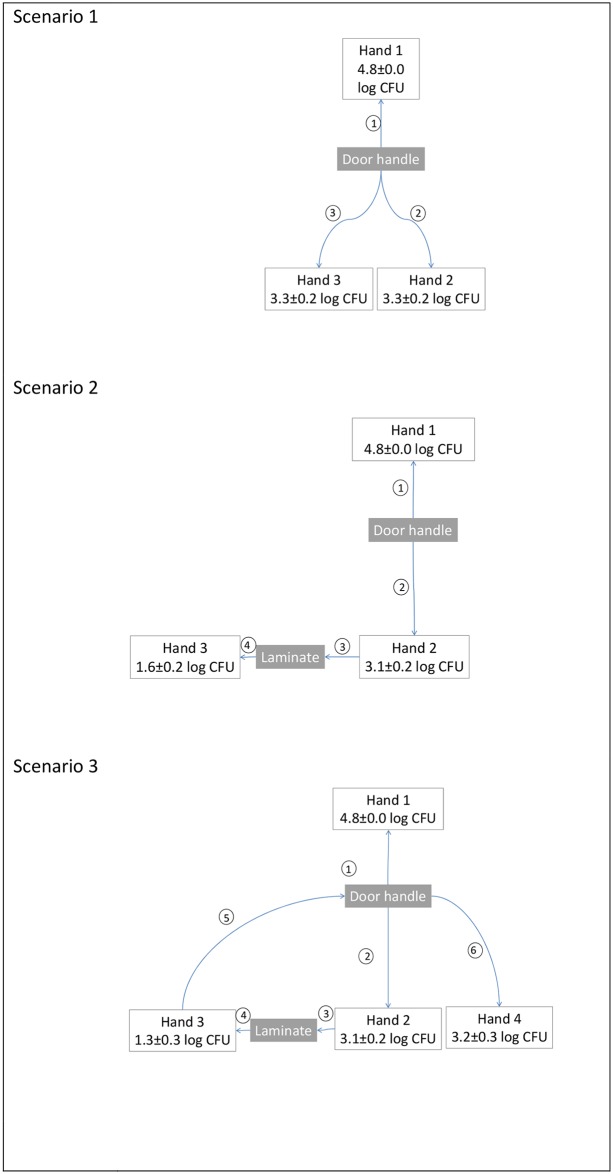
Fig 4. Illustrations of different contamination scenarios where bacteria are transferred between hands and surfaces.
The count on Hand 1 is assumed to be 5 log CFU at the beginning of the scenario and the final count after each scenario is shown. The order of events in the scenario is indicated in the circles. The standard deviation is a result of the variation in the transfer rates for VITRO-SKIN®, stainless steel and laminate.

