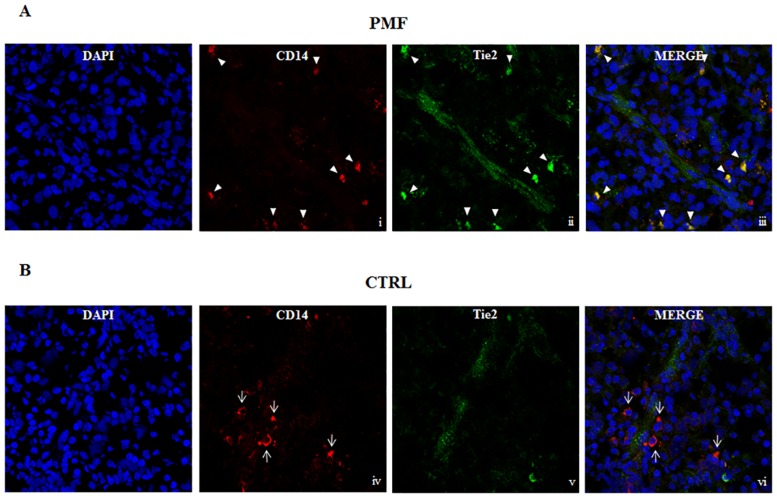
Fig 2. Confocal microscopy images of spleen tissue samples stained with anti-CD14 and anti-Tie2.
Spleen tissue samples were immunostained for the indicated markers and a small capillary from each stained specimen was chosen for display. A) Arrow heads indicate cells expressing both CD14 in red (i) and Tie2 in green (ii) in the perivascular area of spleen tissue sample from 1 representative patient with primary myelofibrosis (PMF). The yellow colour indicates colocalization of CD14 and Tie2 (iii). B) Thin arrows indicate CD14+ cells (iv) not expressing Tie2 (v, vi) in spleen tissue sample from 1 representative CTRL. DAPI (blue) was used as the nuclear marker and the images were incorporated in the merge panels (iii, vi). Images were obtained at 63x magnification.

