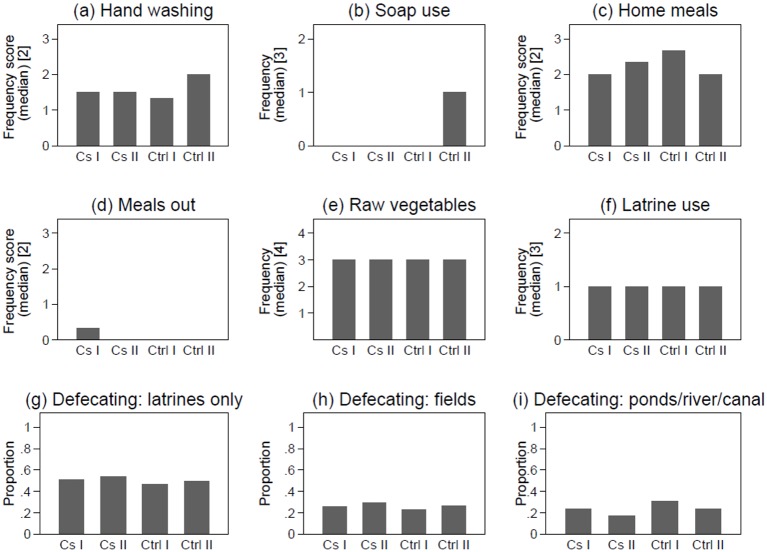
Fig 3. Distribution of individual level risk factors by case definition [1].
1 Type I controls were individuals negative to both serology and culture (n = 305); Type II controls were individuals negative to serology and with a diagnosis other than typhoid (n = 144); Type I cases were individuals with a culture positive result regardless of serological result (n = 174); Type II cases were individuals who had a culture negative but seropositive results (n = 310); 2 Continuous score with values between 0 = Never and 3 = Always. 3 Categorical variable 0 = Sometimes/Never, 1 = Often, 2 = Always. 4 Categorical variable 1 = Less than once a week, 2 = Once a week, 3 = Few times a week, 4 = Every day

