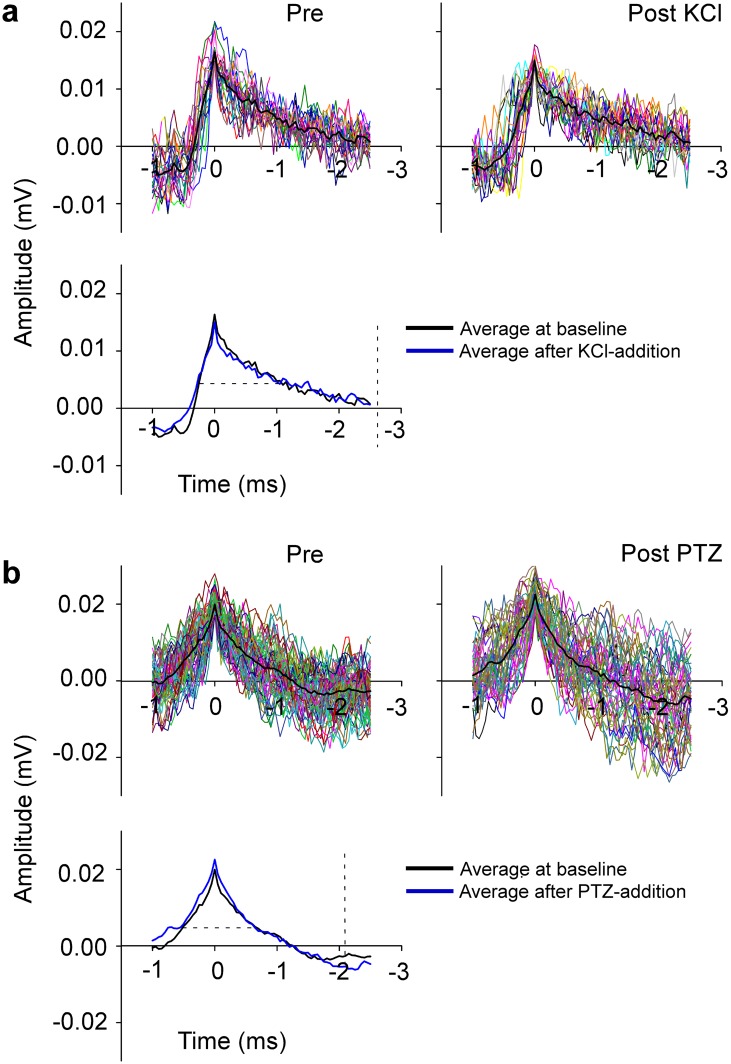
Fig 5. Confirmation of cell stability.
Top panels in (a) show representative single cell recordings before and after KCl addition, top panels in (b) before and after PTZ addition. Bottom panels show averages of baseline and KCl recordings (a) and of baseline and PTZ recordings (b). Dashed lines indicate the width of the averaged action potential at half maximum of the amplitude and they approximate 1.3 ms in both recordings. Action potentials are stable over time as indicated by the unchanged shape of the traces.

