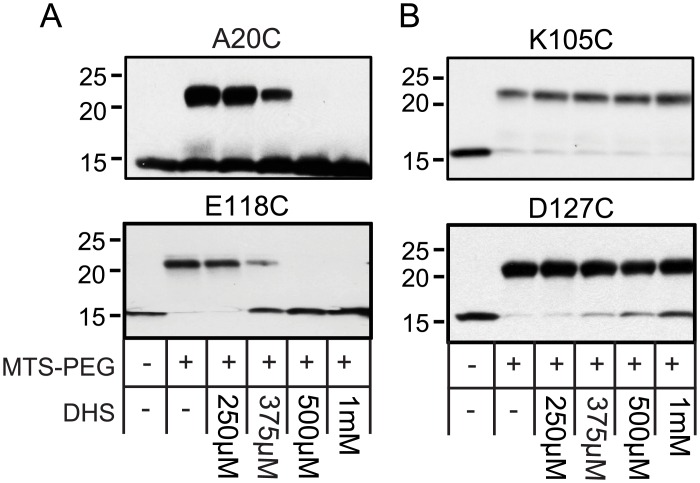
Fig 6. MD simulation snapshots predict additional residues that interact with DHS.
(A) western blot analysis after a competition experiment of two residues predicted to interact with DHS, using the cysteine mutations indicated. The absence (−) or presence (+) of 50 μM MTS-PEG5000 (MTS-PEG), as well as the absence (−) or different concentration of DHS used, are indicated in the table at the bottom. Note that the upper band is protein that has been PEGylated, and that this band disappears as the concentration of DHS is increased (500 μM–1 mM). (B) Western blot analysis after a competition experiment of two residues predicted not to interact with the antibiotic, using the cysteine mutations indicated. Upper PEGylated bands can be seen for all concentrations of DHS (250 μm to1 mM).

