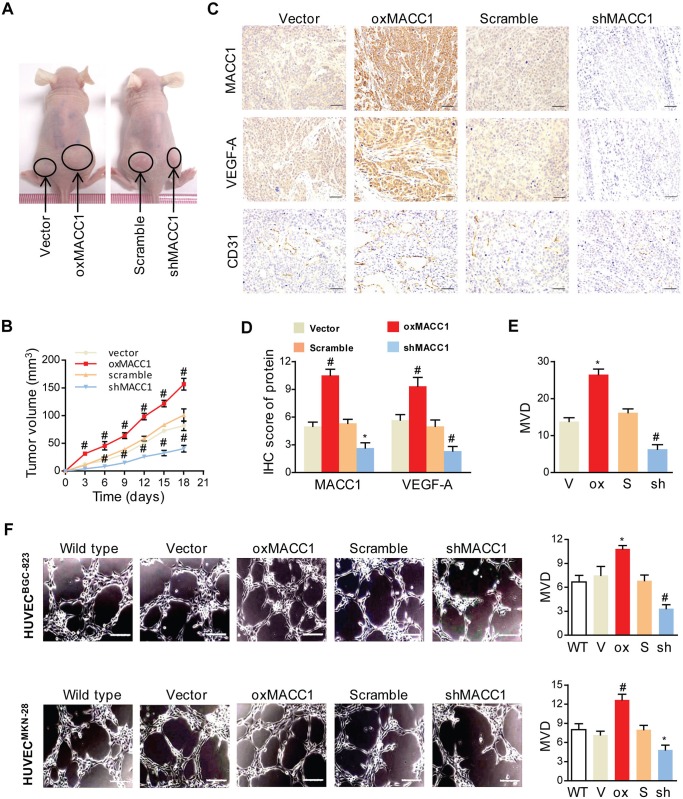
Fig 4. MACC1 promotes angiogenesis in vivo and in vitro.
(A) Representative images of subcutaneous implanted overexpression of MACC1 (oxMACC1) and silencing of MACC1 (shMACC1) tumors of GC xenografts. (B) The tumor volume curves of GC xenografts at 18 days after inoculation. *P < 0.05; #P < 0.01, n = 6. (C-E) Representative immunostaining of MACC1, VEGF-A, CD31 (C) and quantitation (D&E) from GC xenografts with oxMACC1, shMACC1 and their corresponding controls. Scale bar = 50 μm. *P < 0.05; #P < 0.01, n = 6 vs. the corresponding control group. (F) Representative images of tube formation in three-dimensional culture (left panel) and quantitation (right panel) of HUVECs treated with conditioned media from BGC-823 or MKN-28 GC cells for 12 h. WT, wild type. V, vector. Ox, oxMACC1. S, scramble. Sh, shMACC1. Scale bar = 50 μm. *P < 0.05; #P < 0.01, n = 3.

