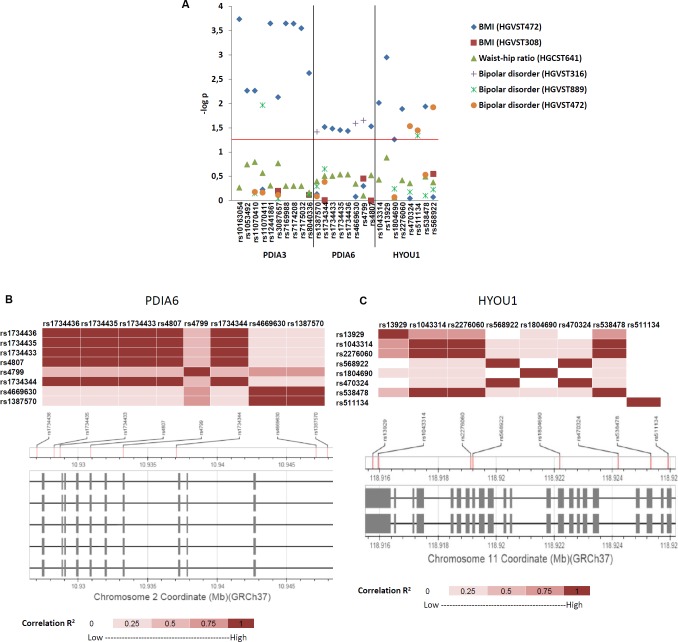
Fig 10. Human ER molecular chaperon SNPs associated with body mass index and bipolar disorder.
(A) Summary figure of SNP association results from Genome Central [39] for PDIA3, PDIA6 and HYOU1 linkage to body mass index (BMI), Weight-hip ratio and bipolar disorder. Horizontal axis lists significant SNPs and genes. The red line represents P = 0.05 nominal significance level; above the line represents significant results. (B) Linkage disequilibrium between SNPs in PDIA6. Boxes = exons, lines between boxes = introns, The LD between SNPs in the CEU population is expressed as R2 and displayed as a color code below the plot. (C) Linkage disequilibrium between SNPs in HYOU1. Boxes = exons, lines between boxes = introns, The LD between SNPs in the CEU population is expressed as R2 and displayed as a colour code below the plot.

