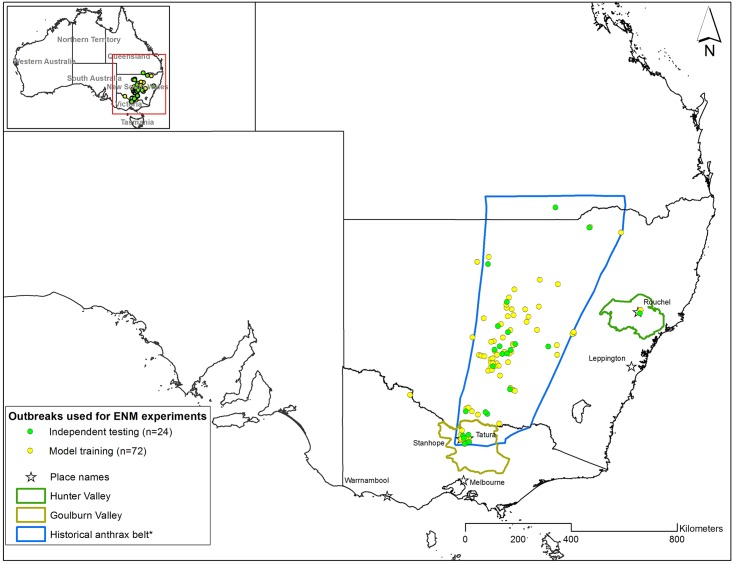
Fig 2. Distribution of anthrax outbreak locations used for ecological niche modeling (ENM) experiments.
Yellow dots represent the data points used for model building (n = 72) and green dots were used for model validation (n = 24). *Heads-up digitized from Durrheim et al. [17].

