
Fig 1. Summary of the heterogeneity, minor allele frequency (MAF) and polymorphic information content (PIC) of 18,082 selected SNPs.
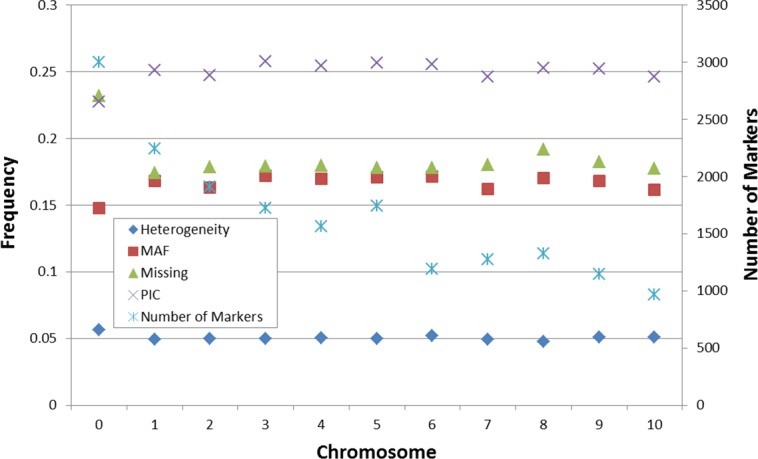
Chromosome assignments are indicated; where no BLAST position was available, the chromosome is designated as “0”; The heterogeneity, MAF, percentage of Missing value, PIC was shown in left y-axis, the number of marker for each chromosome was shown in right y-axis.