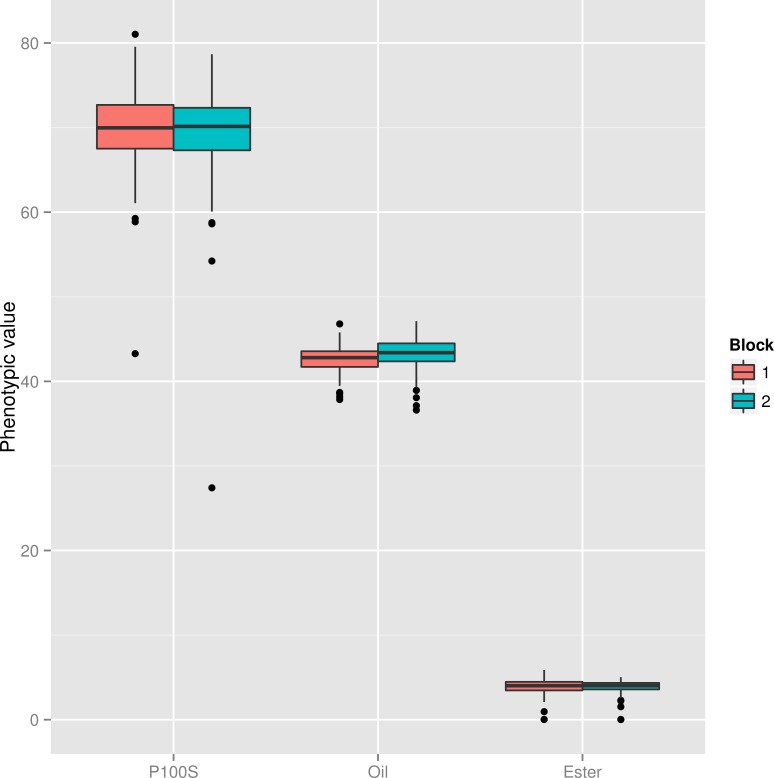
Fig 1. Phenotypic trait evaluation using the Boxplot analysis.
Vertical bars are second and third quantiles, and the dots outside the bars are outliers. Each block was evaluated separately, allowing their individual evaluation. W100S –weight of 100 seeds; SOC–seed oil content; PEC–phorbol ester concentration.

