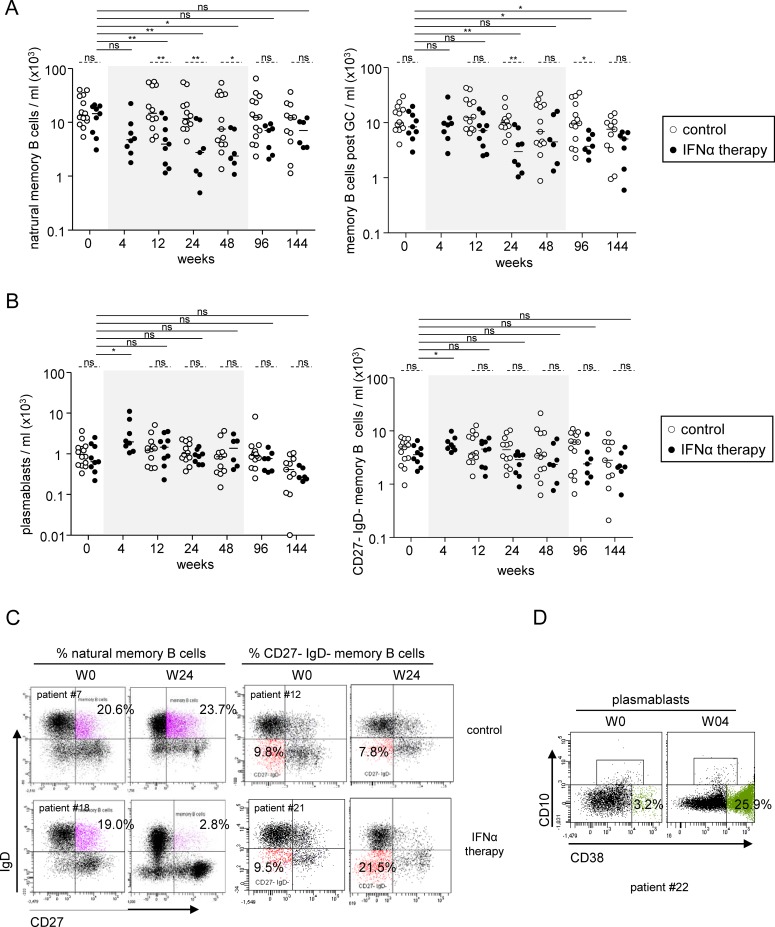
Fig 3. Impact of Peg-IFN-α on peripheral memory B-cell subsets and plasmablast distribution.
Evolution of B cell subsets was evaluated in patients with CHB before and at different time points during the treatment with nucleos(t)ide analog alone (open circles, n = 11–14) or together with Peg-IFN-α (black circles, n = 8–9). Absolute numbers of (A) natural memory B-cell subsets (left panel), and post-GC memory B cells (right panel), (B) plasmablasts (left panel) and CD27- IgD- memory B-cell subsets (right panel). (C) Representative dot plots of the frequency of natural memory (left) and CD27- IgD- memory (right) B cells from patients treated with nucleos(t)ide analog alone (upper panel) or together with Peg-IFN-α (lower panel) before and after 24 weeks of treatment. Dot plots are gated on CD19+ cells. (D) Accumulation of plasmablasts during Peg-IFN-α therapy. Representative dot plots of the frequency of plasmablasts from patients treated with nucleos(t)ide analog together with Peg-IFN-α before (left panel) and after (right panel) 4 weeks of treatment. Dotplots are gated on CD19+IgD-CD27+ cells. The gray area represents the period of Peg-IFN-α administration. Bars represent median. P values were calculated using the Wilcoxon test (straight lines) or the Mann-Whitney test (dashed lines). * p<0.05, ** p<0.01, *** p<0.001.

