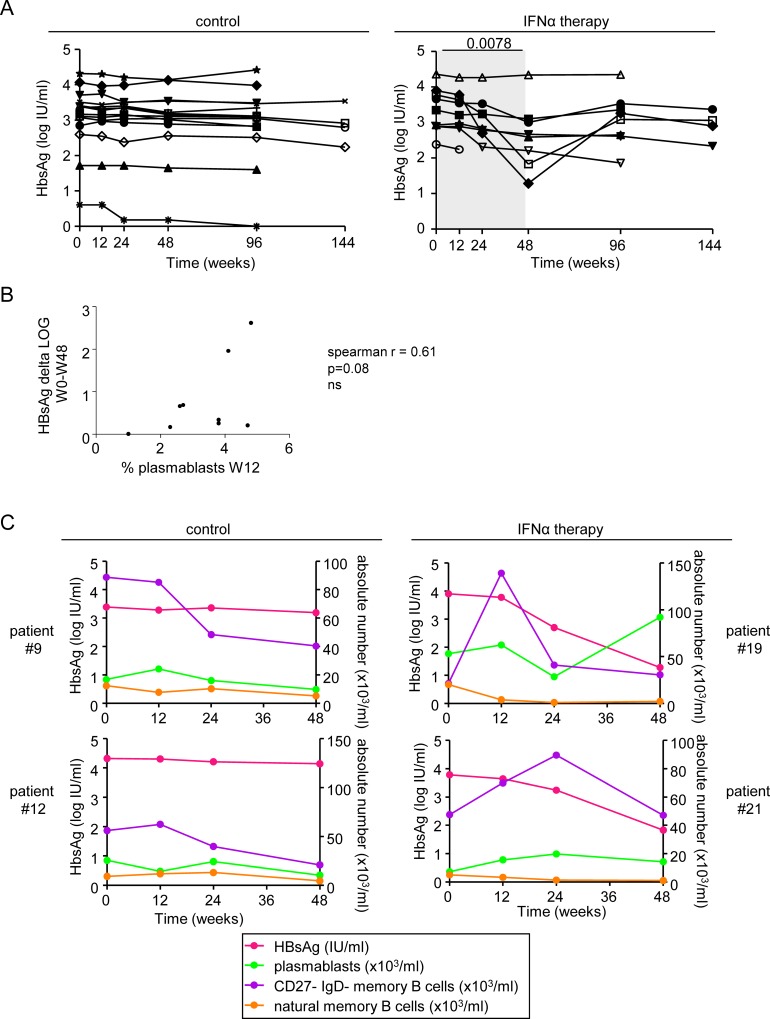
Fig 6. Correlations between the clinical features of patients and immune parameters.
(A) Evolution of HBsAg in patients with CHB infection treated with nucleos(t)ide analog alone (left panel, n = 14) or together with Peg-IFN-α (right panel, n = 9). The gray area represents the period of Peg-IFN-α administration. (B) Correlations between the decline of HBsAg during Peg-IFN-α therapy and proportions of plasmablasts at W12. Spearman correlation. (C) Superposition of the evolution of HBsAg level and absolute numbers of B-cell subsets for patients #9 and #12 treated with NA alone, and for patients #19 and #21 treated with NA together with Peg-IFN-α.

