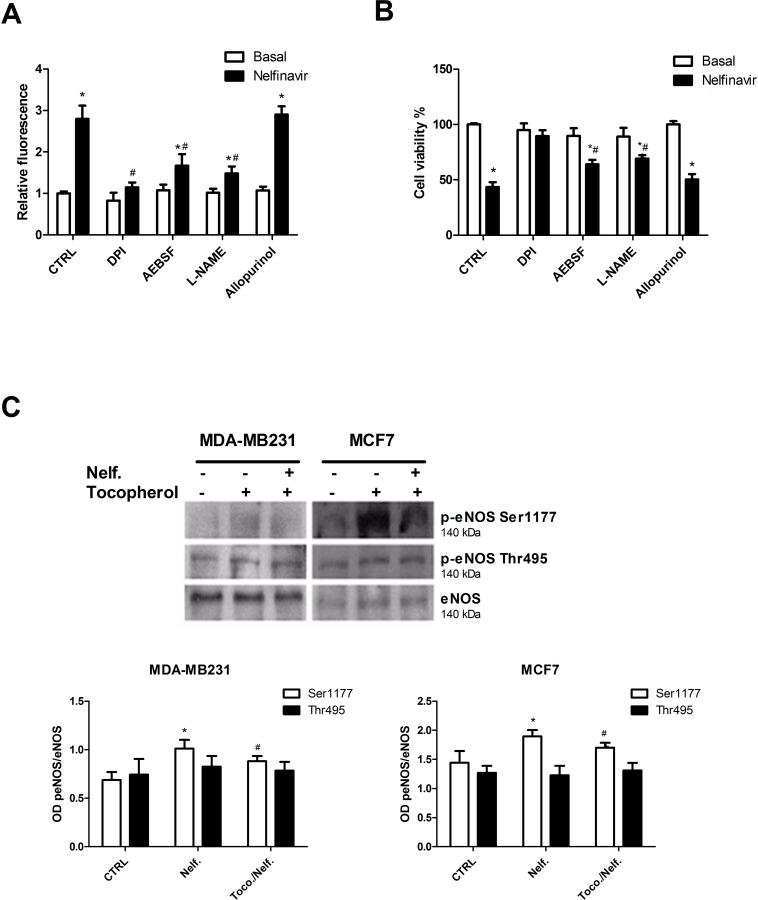
Fig 9. Nelfinavir-mediated ROS increase and cytotoxicity depend on flavoenzyme activation.
(a) MCF-7 cells were treated with or without Nelfinavir (10 μM) for 30 minutes after pre-incubation with DPI (20 μM), AEBSF (40 μM), L-NAME (5 mM) or allopurinol (100 μM). The different cell conditions were analyzed for ROS content by FACS measurement of H2DCF-DA. Each value represent mean of three biological experiments ± S.D. normalized on nelfinavir-untreated cells value (*p< 0.05 vs basal; # p< 0.05 vs Nelfinavir). (b) A similar experiment was performed using nelfinavir for 24 hours in MCF-7 cells pre-treated with DPI (20 μM), AEBSF (40 μM), L-NAME (5 mM) or allopurinol (100 μM), and MTT-derived staining intensities were analyzed by a photometer. Bar graphs report the values of mean of three independent biological experiments ± S.D., normalized on nelfinavir-untreated cells value (*p< 0.05 vs basal; # p< 0.05 vs Nelfinavir). (c) MDA-MB231 and MCF-7 cells were treated with nelfinavir for 30 minutes in the absence or presence of 35 μM tocopherol, then lysed and subjected to western blot for eNOS, phopho-eNOS(Ser1177) and phospho-eNOS (Thr495). Densitometric analysis of proteins signals relative to eNOS signal was shown. The values display the means ± S.D. of three independent biological experiments and are compared to control value (*p< 0.05 vs ctrl; # p< 0.05 vs Nelfinavir).

