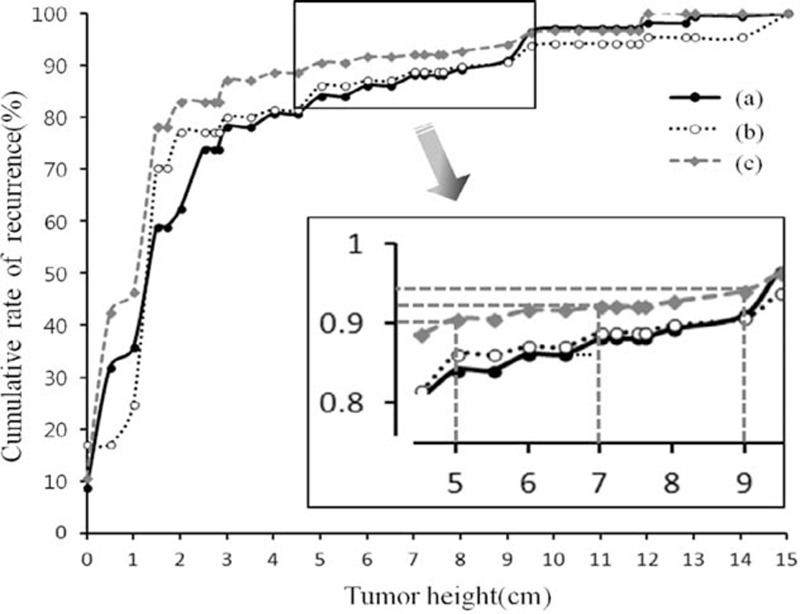
FIGURE 2.

Predicted model for cumulative local relapse rate according to the tumor height: A, curve was drawn using raw data; B, curve was drawn after removing effects of 3 variables, venous invasion, mesenteric LN metastasis, and depth of tumor that were statistically significant in multivariate analysis; at last, C, curve was drawn after removing effects of all variables.
