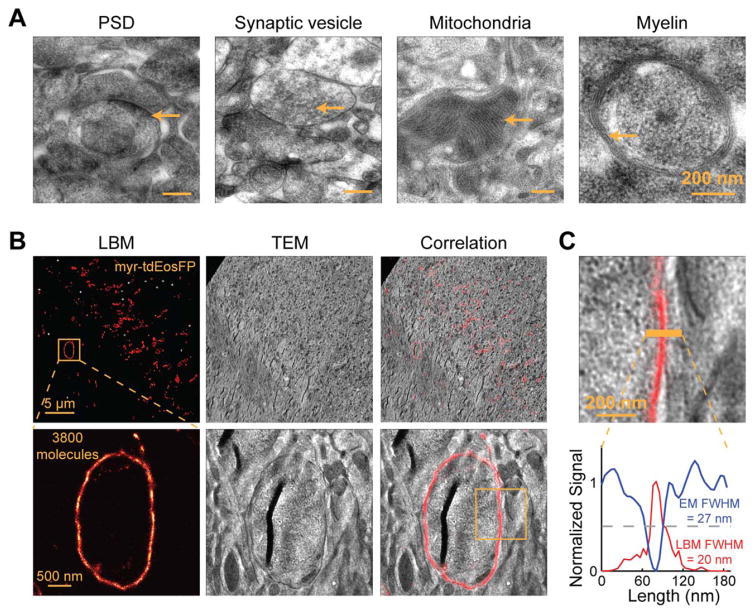
Focus Box Fig. 2.
EM characterization of our sample procedure and LBM/EM correlations. A: Representative TEM images showing ultrastructures in mouse brain tissue preserved using our sample preparation procedure. B: Representative LBM/EM correlative images. Myristoylated tdEosFP was expressed in a subset of neurons in the fly optic lobe to label the plasma membrane, and imaged by LBM (left). The same section was later imaged with TEM (middle), and the LBM and EM images were then correlated with each other (right). The yellow box in the lower right panel corresponds to the zoom-in image in panel (C). C: A zoom-in view of the LBM/EM correlative image from the yellow box in panel (B) (top) with the LBM and EM intensity profiles shown as red and blue lines, respectively (bottom). Note that stronger EM intensity is darker and has lower values. The overlapping peaks and troughs, and comparable full width half maximums (FWHMs) from LBM and EM demonstrate the alignment accuracy and confirm the resolution of the LBM method.

