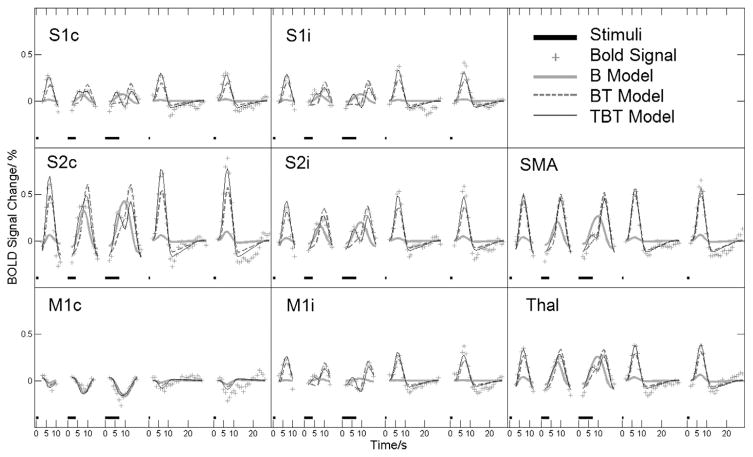
Fig. 1.
Group-averaged time courses of the BOLD response in eight example voxels from different regions of the somatosensory–motor system: primary somatosensory cortex (S1), secondary somatosensory cortex (S2), primary motor cortex (M1) contralateral(c) or ipsilateral (i) to the stimulus, supplementary motor area (SMA) and thalamus (Thal). For each voxel, all five responses to the 1-s, 4-s and 7-s stimuli with 10-s ISI and 0.5-s and 1-s stimuli with 30-s ISI are shown (stimulus lengths are marked above the time axis as thick black lines). Fitted curves are also shown in each case for the boxcar (B), boxcar–offset transient (BT) and onset transient–boxcar–offset transient (TBT) models.

