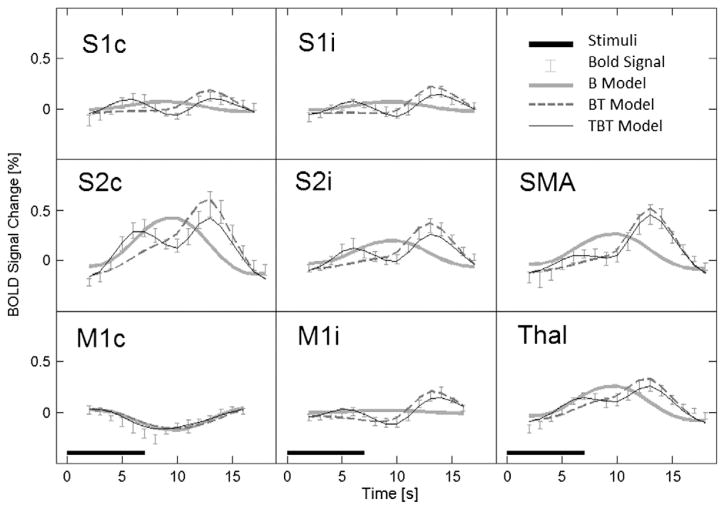
Fig. 2.
Group-averaged time courses of the BOLD response and associated fitted curves for the B, BT and TBT models for the same voxels and representation format as given in Fig. 1. Only the experimental data and fitted curves for the 7-s stimulus duration are shown here, allowing the bimodal response to be observed clearly.

