
Fig. 4.
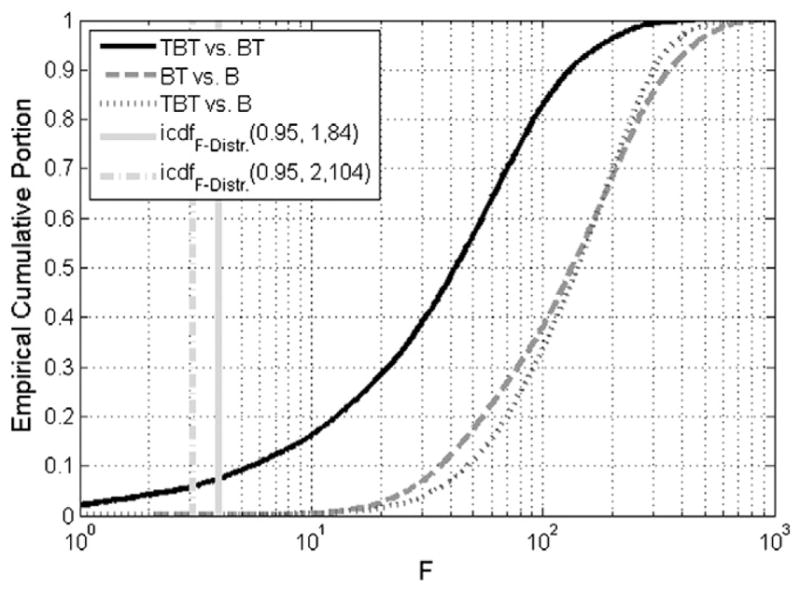
Empirical cumulative distributions of F values for all voxels active in the TBT model for model comparisons TBT vs. BT, TBT vs. B, and BT vs. B. As a marker of significance, the F values of the inverse cumulative distribution function (icdf) for 0.95 are given for the range of degrees of freedom within these voxels, which correspond to a P value of .05.