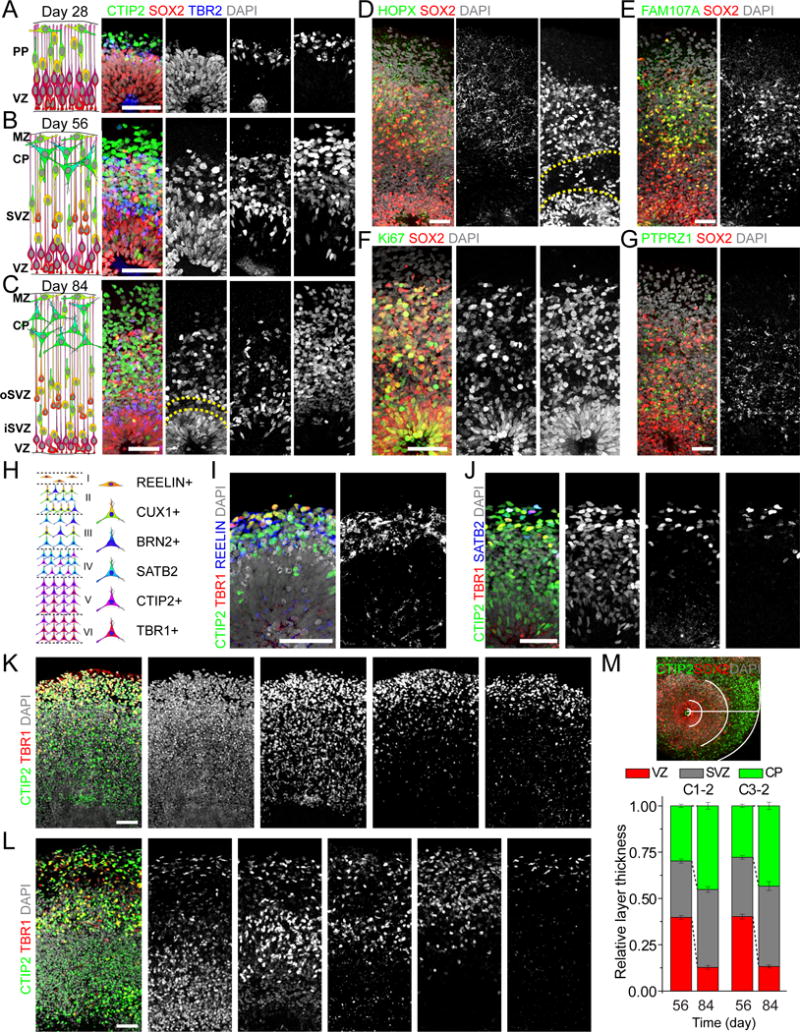
Figure 3. Organization and Marker Expression of Different Progenitor Zones and Cortical Neuron Subtypes.

(A–C) Schematic representations and sample immunostaining images of forebrain organoids at days 28 (A), 56 (B) and 84 (C). Scale bars: 50 μm. Dash lines highlight a gap between oSVZ and iSVZ (C). PP: preplate; VZ: ventricular zone; MZ: marginal zone; CP: cortical plate; SVZ: subventricular zone; oSVZ: outer subventricular zone; iSVZ: inner subventricular zone.
(D–G) Sample images of immunostaining of oRGC markers HOPX (D), FAM107A (E) and PTPRZ1 (G), and Ki67 (F) in day 84 forebrain organoids. Scale bars: 50 μm.
(H) Schematic representation of marker expression for cortical neurons in the mature mammalian neocortex.
(I) Sample images of immunostaining for preplate Cajal-Retzius cell marker REELIN and deep layer neuron markers CTIP2 and TBR1 in day 28 forebrain organoids. Scale bar: 50 μm.
(J–K) Sample images of immunostaining for CTIP2, TBR1 and superficial layer neuron marker (SATB2) in forebrain organoids at days 56 (J) and 70 (K). Images shown in (K) are from consecutive sections for the same cortical structure. Scale bars: 50 μm.
(L) Sample images of immunostaining for CTIP2, TBR1 and superficial layer neuron markers (SATB2, BRN2 and CUX1) in forebrain organoids at day 84. Images shown are from consecutive sections for the same cortical structure. Scale bar: 50 μm.
(M) Sample image showing layer specification in forebrain organoids and quantification of the relative thickness of VZ, SVZ and CP at days 56 and 84 for two iPSC lines. For each cortical structure, three measurements were taken at 45 degree angles to obtain the mean. Values represent mean ± SEM (n ≥ 6 cortical structures from 6 organoids).
Also see Figure S3.
