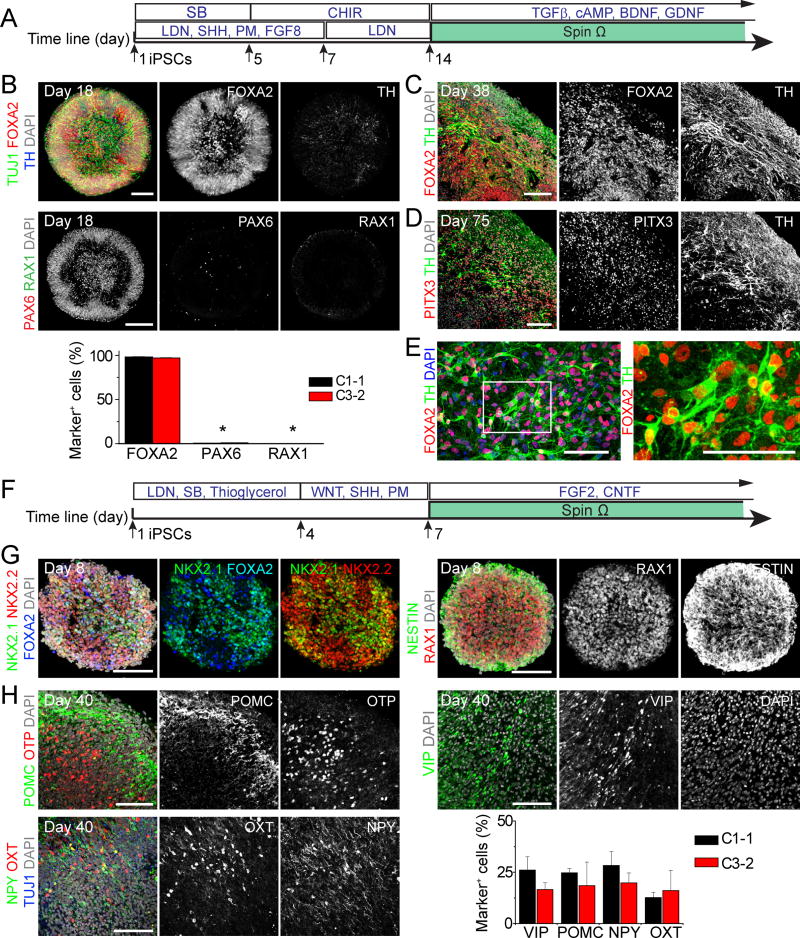
Figure 6. Generation of Midbrain and Hypothalamic Organoids.
(A–E) Midbrain organoids from human iPSCs. Shown in (A) is a schematic diagram of the midbrain organoid protocol. Shown in (B) are sample images of day 18 organoids (Scale bars: 100 μm) and quantifications. Values represent mean ± SEM (n = 4 organoids each; *P < 0.05, Student’s t-test). Also shown are sample images of immunostaining of midbrain organoids at day 38 (C) and day 75 (D), and monolayer cultures 5 days after dissociation and plating of day 65 midbrain organoids (E). Scale bars: 50 μm.
(F–H) Hypothalamic organoids. Shown in (F) is a schematic diagram of the hypothalamic organoid protocol. Shown are sample images of day 8 (G) and day 40 (H) organoids. Scale bars: 100 μm. Also shown in (H) is a summary of quantification for peptidergic neuronal markers expression in day 40 hypothalamic organoids from 2 iPSC lines. Values represent mean ± SEM (n = 3 organoids each).
Also see Figure S6.

