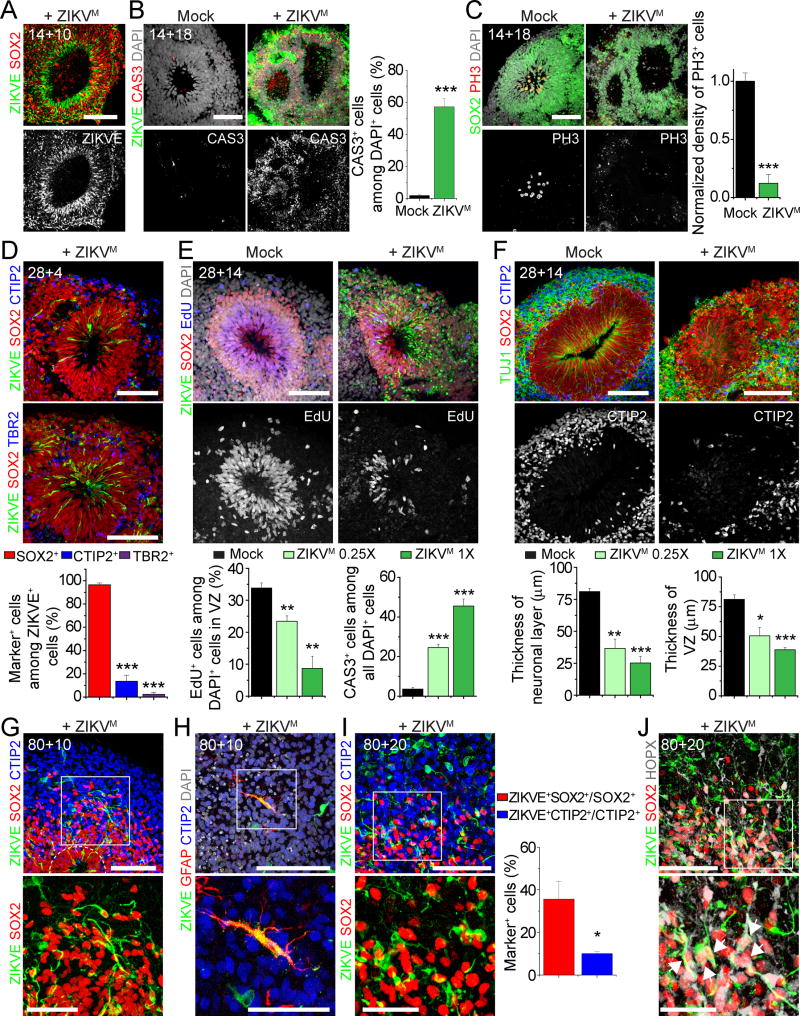
Figure 7. Modeling Impact of ZIKV Exposure using Forebrain Organoids.
(A) Sample immunostaining images of forebrain organoids exposed to ZIKVM (1X) or mock-treated at day 14 for 24 hours and analyzed 10 days later (14+10). Scale bar: 100 μm.
(B–C) Sample immunostaining images of forebrain organoids exposed to ZIKVM (1X) or mock-treated at day 14 for 24 hours and analyzed 18 days later (14+18) for CAS3 (B), or PH3 (C). Scale bars: 100 μm. Also shown are quantifications for the percentage of CAS3+ cells among the total number of nuclei stained by DAPI (B) and density of PH3+ cells within VZ (C). Values represent mean ± SEM (n = 5 organoids; *** P < 0.0005, Student’s t-test)
(D) Sample immunostaining image of a forebrain organoid exposed to ZIKVM (1X) at day 28 for 24 hours and analyzed 4 days later (28+4) (Scale bars: 100 μm) and quantifications. Values represent mean ± SEM (n = 5 cortical structures from 3 organoids; *** P < 0.0005, Student’s t-test).
(E–F) Forebrain organoids exposed to ZIKVM (1X or 0.25X) or mock-treated at day 28 for 24 hours and analyzed 14 days later (28+14). Shown are sample immunostaining images and quantification of cell proliferation and cell death in ZIKV-infected regions (E) and thickness of SOX2+ VZ layer and TUJ1+ neuronal layer (F). Scale bars: 100 μm. Values represent mean ± SEM (n = 5 cortical structures from 3 organoids; *P < 0.05; **P < 0.005, ***P < 0.0005, Student’s t-test).
(G–J) Sample immunostaining images (top; Scale bars: 100 μm) and magnified views (bottom; Scale bars: 50 μm) of forebrain organoid exposed to ZIKVM (1X) at day 80 for 24 hours and analyzed 10 days (80+10; G–H) or 20 days later (80+20; I–J). Arrows in (J) point to ZIKV+HOPX+SOX2+ oRGC-like cells in the oSVZ region. Also shown in (I) are quantifications for the percentage of ZIKV+ cells among the total number of SOX2+ or CTIP2+ cells in the whole cortical structure. Values represent mean ± SEM (n = 7 cortical structures from 5 organoids, *P < 0.05, Student’s t-test).
Also see Figure S7.

