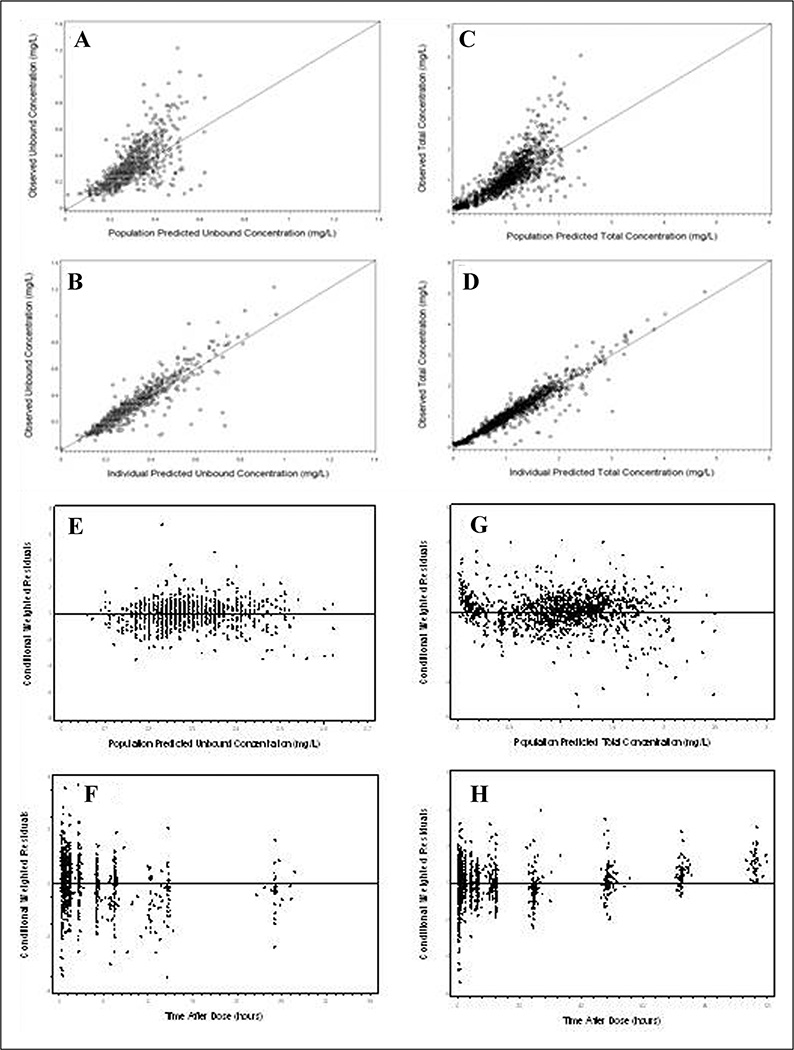
Figure 2.
Goodness of fit plots for the final population pharmacokinetic model. (A) Identity plot of observed versus population predicted unbound concentration. (B) Identity plot of observed versus individual predicted unbound concentration. (C) Identity plot of observed versus population predicted total concentration. (D) Identity plot of observed versus individual predicted total concentration. (E) Scatter plot of conditional weighted residuals (CWRES) versus population predicted unbound concentration. (F) Scatter plot for CWRES versus time after dose for unbound concentration fit. (G) Scatter plot for CWRES versus population predicted total concentration and (H) Scatter plot for CWRES versus time after dose for total concentration fit.

