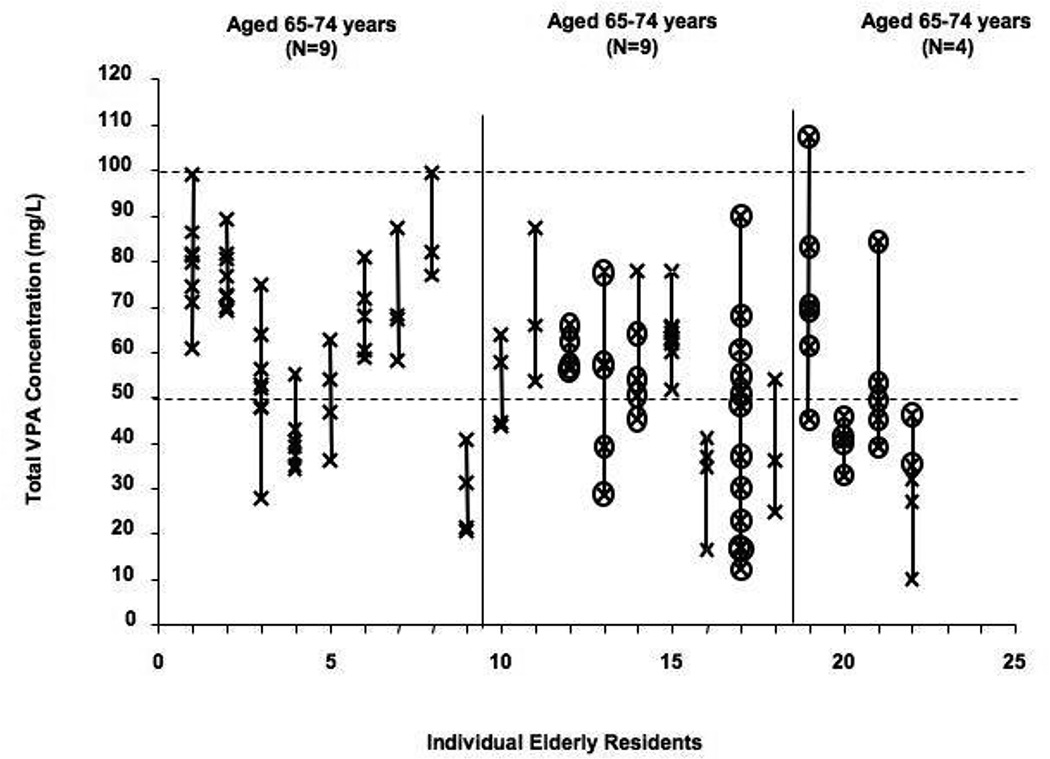
Figure 2. Total Valproic Acid Concentrations Observed in Elderly Nursing Residents by Order of Ascending Age.
Each symbol (x) represents a single total VPA measurement. A line connects all of the total VPA measurements within an individual resident. Residents are segregated into age groups (65–74 years, 75–84 years, or 85+ years) according to their age at enrollment. The "therapeutic" range for VPA is marked by a dashed line at 50 and 100 mg/L. Circled concentrations signify concentrations that were observed during administration of syrup.

