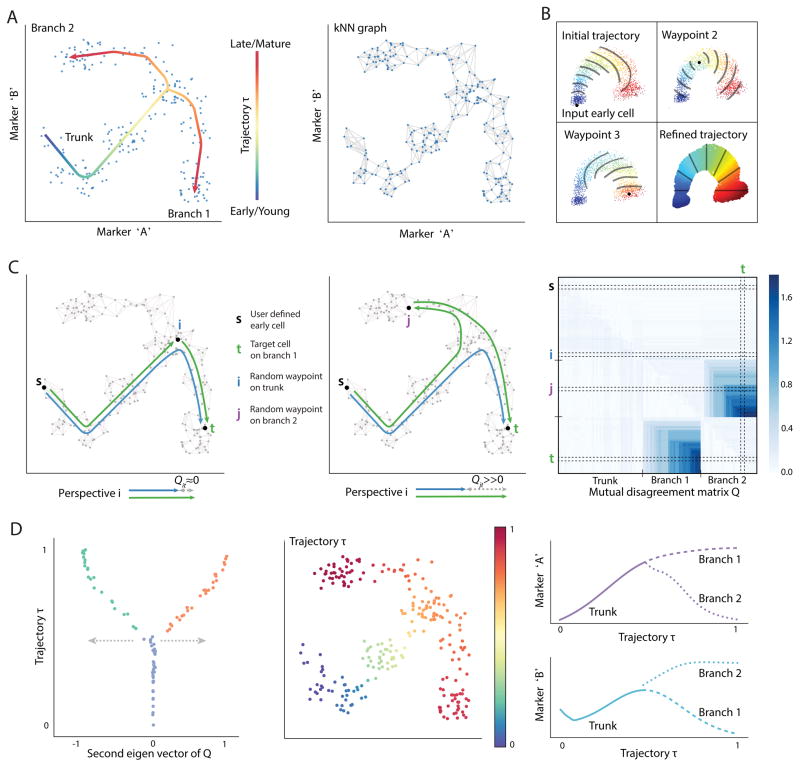
Figure 1. Alignment of cells along bifurcating trajectories.
(A) Wishbone aims to achieve high resolution ordering and branching of cells along bifurcating developmental trajectories. The data is represented as a k-nearest neighbor graph where each cell is a node and edges connect each cell to its most phenotypically similar cells. A cartoon depiction of a kNN graph is illustrated. The data depicted in this figure is simulated.
(B) Wishbone uses a set of cells called “waypoints” to guide the ordering of cells. An initial ordering is derived using the shortest path distances from the input early cell (top left panel). The distances from waypoints are aligned to the initial ordering to derive waypoint perspectives and the refined trajectory is determined as a weighted average of these perspectives (bottom right panel). The contour lines illustrate bands of cells that are at a similar distance from the corresponding waypoint.
(C) Waypoints are also used for branch point identification and branch associations. The difference between the shortest path of waypoint t from early cell and a path that goes through another waypoint i is ≈ 0 if i and t are on the same trajectory (left panel) and ≫ 0 if they are on different branches (middle panel). These disagreements accumulate in the presence of a true branch to create a mutual disagreement matrix Q: observed are two sets of waypoints that agree within the set and disagree between sets (right panel).
(D) The second Eigen vector of the Q matrix provides a summary of the disagreements with values ≈ 0 for waypoints on the trunk, > 0 for waypoints on one branch and < 0 for waypoints on the other branch. The branch point and branch associations are used to further refine the trajectory. The resulting trajectory and branches are used to study marker dynamics along differentiation.

