Figure 4.
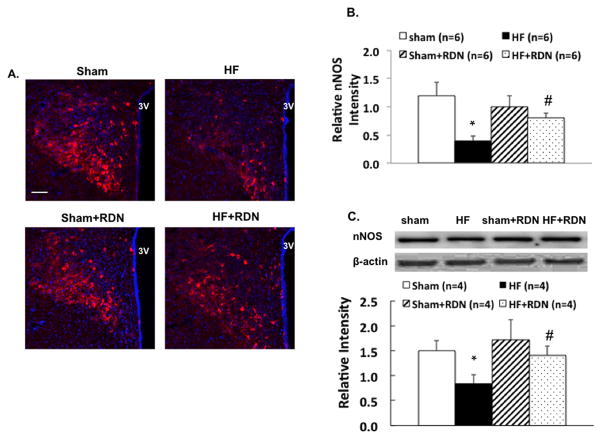
A. Representative pictures of PVN with nNOS staining (A) in four groups of rats, sham, HF, sham+RDN and HF+RDN. Bar = 100 μm. B. Mean values of relative nNOS intensity in the PVN. C. nNOS protein expression in the sham and HF rats with/without RDN. *P < 0.05 vs. sham; #P < 0.05 vs. without RDN.

