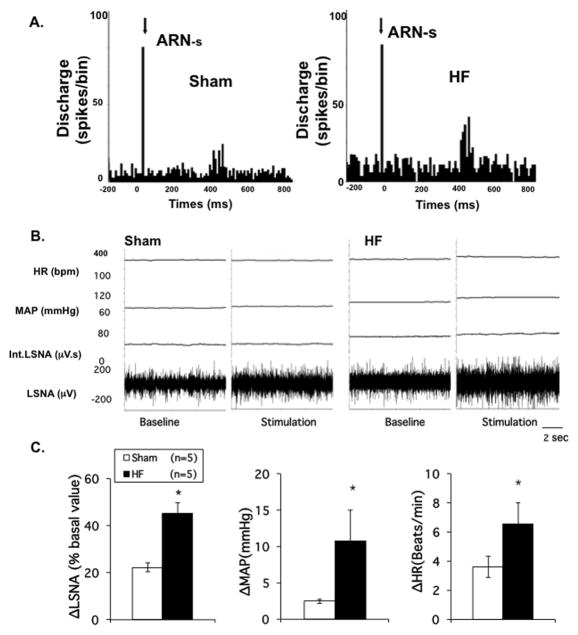
Figure 6.
A. Discharge of RVLM projecting PVN neurons to ARN stimulation. Peristimulus histogram of spike occurrence triggered by electric stimulation of the afferent renal nerve with 100 sweeps, bin = 0.02 s. ARN-s: afferent renal nerve stimulation. Segments of original recordings of changes in discharge after ARN stimulation in sham and HF rats. B. Original recordings showing changes in LSNA, MAP and HR before and after ARN stimulation (40 Hz) in individual sham and HF rats. C. Mean percent change of LSNA, MAP and HR to ARN stimulation in sham and HF groups. * P < 0.05 vs. sham.

