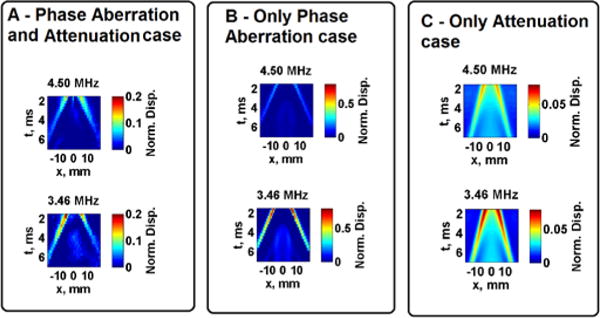
Fig. 7.

Measured and simulated normalized shear wave peak displacement at focus. Images in Panel A show results from the Phase Aberration and Attenuation case, Panel B shows results from the Only Phase Aberration case and Panel C shows results from the Only Attenuation case. Images in the top row represent the push beam frequency of 4.50 MHz, images in the bottom row represent the push beam frequency of 3.46 MHz. Images in Panels A and B are from measurements and the images in Panel C are from simulations of tissue Sample 1.
