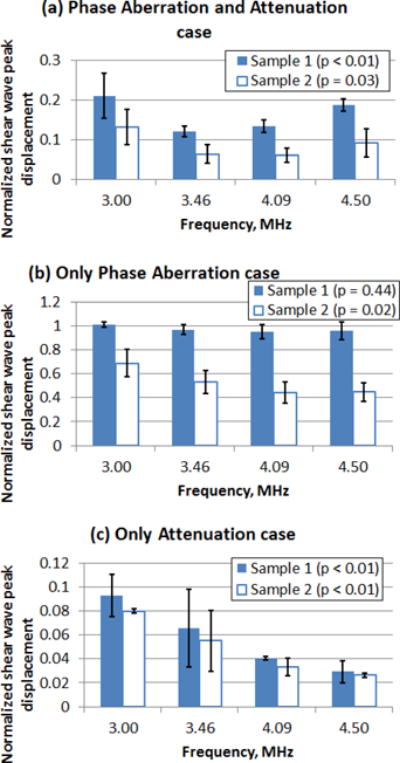
Fig. 8.

Mean normalized temporal shear wave peak displacement from pushing through four locations of tissue Sample 1 and Sample 2. (a) Phase Aberration and Attenuation case, (b) Only Phase Aberration case and (c) Only Attenuation case. The error bars represent the 95% confidence interval (n = 4).
