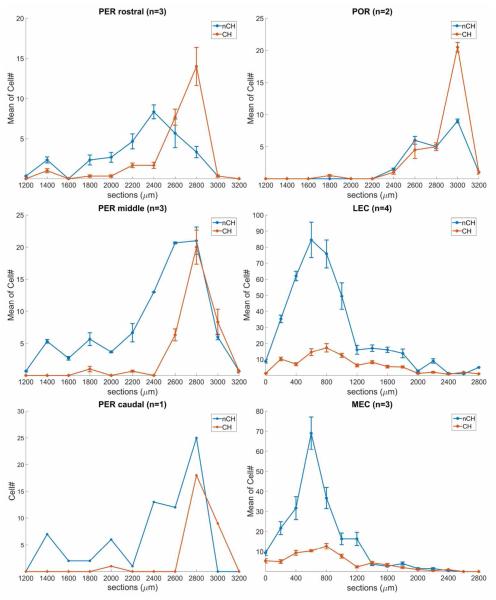
Figure 10.
Graphical display of the normalized averaged cell numbers in the perirhinal (PER), postrhinal (POR), lateral entorhinal (LEC) and medial entorhinal (MEC) groups. Y axis: mean number of cholinergic (red) and non-cholinergic (blue) neurons in GP for PER and POR groups and in MS/VDB, HDB, SI, and GP for LEC and MEC groups; X axis: distance in μm from the crossing of the anterior commissure (PER, POR cases). In LEC and MEC cases 0 level corresponds to the appearance of the most rostral cholinergic neurons in the medial septum. Bars represent standard deviation of the mean. 166×201mm (300 × 300 DPI)

