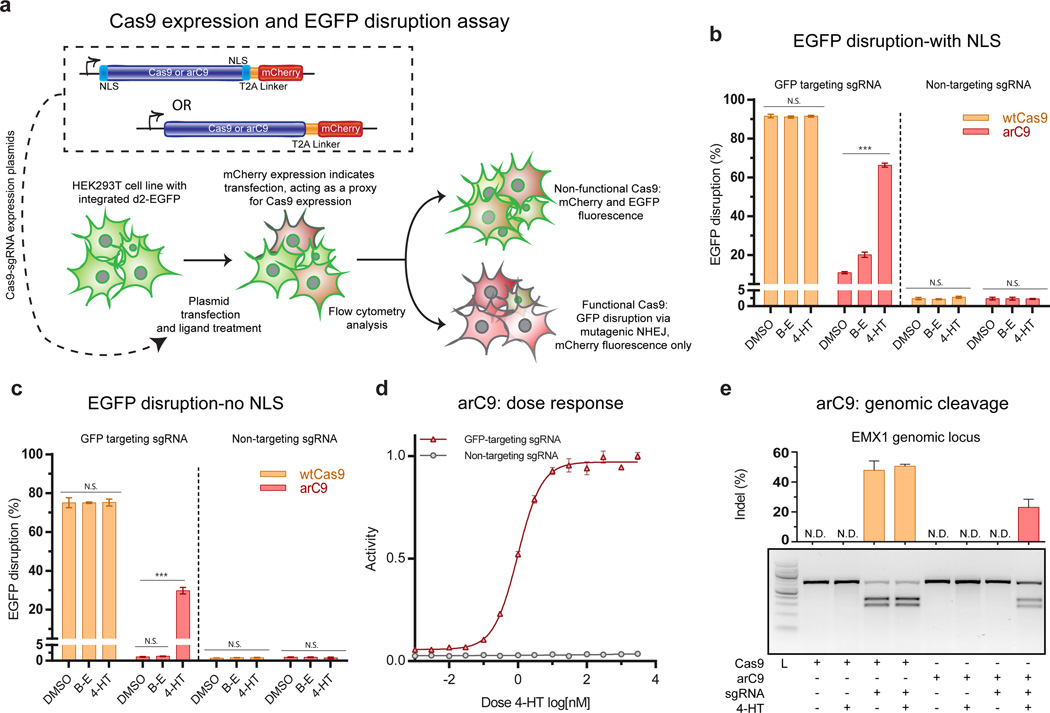
Figure 3. Validating arC9 in eukaryotic cells.
(a) Schematic of the arC9:231 expression constructs and GFP disruption assay. (b) Quantification of EGFP disruption at 72 hours for Cas9 and arC9 with a N- and C-terminal nuclear localization signal (NLS) (n=3). These data demonstrate a ~6 fold increase in EGFP disruption. Background activity of arC9 is 10.9 ± 0.5% (S.D.) while EGFP disruption in the presence of 300 nM 4-HT increases to 66 ± 1% (S.D.) Error bars represent one standard deviation of biological replicates. (c) Quantification EGFP disruption at 72 hours for Cas9 and arC9 without an NLS (n=3). Background activity of arC9 is not significantly different from a non-targeting negative control, t-test. EGFP disruption in the presence of 4-HT increases to 30 ± 2% (S.D.) this represents at least a 24-fold increase in arC9 activity in the presence of 300 nM 4-HT, t-test (*** p values < 0.001). (d) Dose response of arC9 w/o NLS normalized to maximum activity. IC50 is 1.0 ± 0.2 nM (S.D). (e) T7EI assay of Cas9 and arC9 mediated indel formation at the EMXI locus at 72 hours. Cas9 with the targeting guide causes indels regardless of treatment condition, arC9 only cleaves a genomic locus in the presence of 4-HT. Quantification and error bars represent the standard deviation of biological replicates (n=3). N.D. signifies not detected, below the detection limit of the assay.

