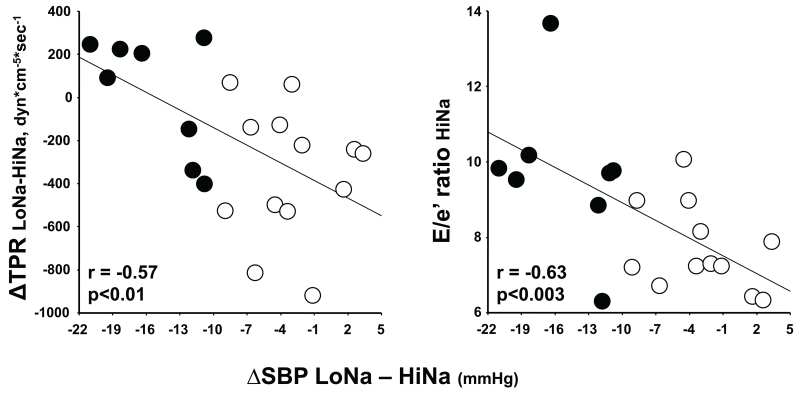
Fig 4.
Relationships of the magnitude of SSBP; i.e., the difference in systolic BP between the low salt and high salt days of the experiment, (ΔSBP LoNa – HiNa, mmHg) with the change in TPR from LoNa to HiNa (left panel, ΔTPR LoNa-HiNa, dyn*cm-5*sec-1) or with the ratio between the E velocity of mitral inflow and the tissue Doppler e annular velocity on the HiNa day (right panel, E/e’ ratio HiNa). Black and white circles represent SS and SR subjects, respectively. Correlation coefficients, the regression lines and the statistical significance are for the 21 normotensive volunteers analyzed altogether.

