
Figure 5.
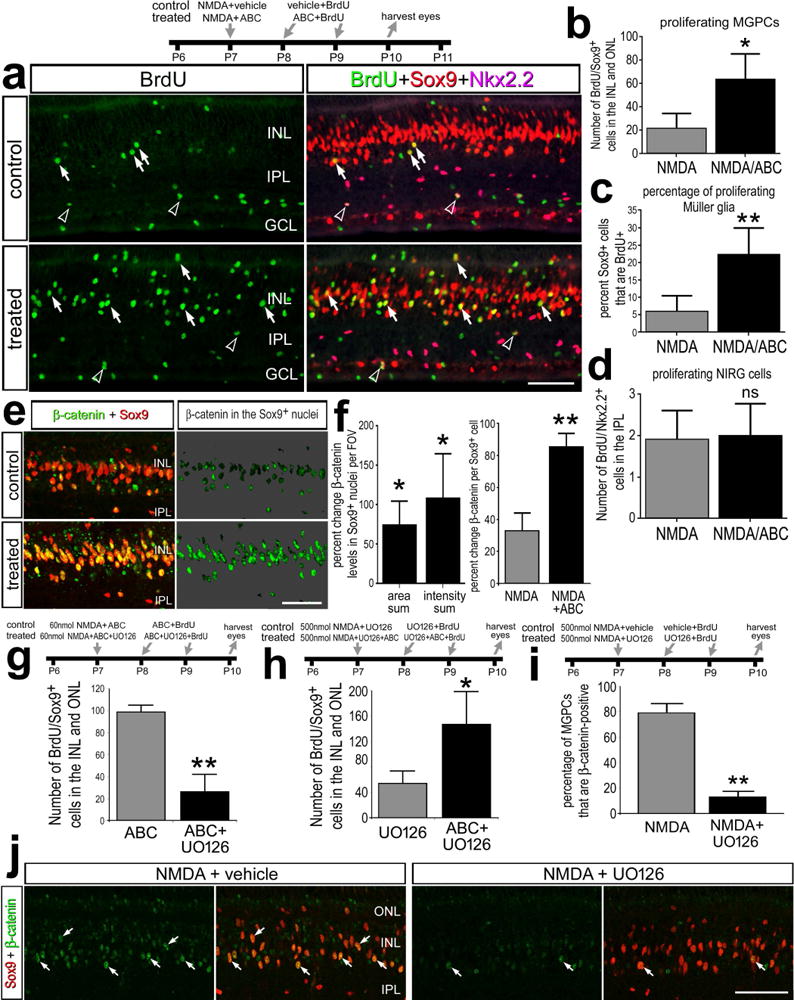
Activation of Wnt-signaling with GSK3β-inhibitors increases numbers of proliferating MGPCs and stimulates the accumulation of nuclear β-catenin in MGPCs in NMDA-damaged retinas. Eyes were injected with a relatively low dose (60 nmol) or high dose (500 nmol) of NMDA ± GSK3β-inhibitors ± MEK-inhibitor (UO126) at P7, GSK3β-inhibitors ± MEK inhibitor and BrdU at P8 and P9, and retinas were harvest at 3 days after NMDA-treatment at P10. Sections of the retina were labeled with antibodies to BrdU (green), Sox9 (red) and Nkx2.2 (magenta; a), or nuclear β-catenin (green) and Sox9 (red; e and j). The histograms in b, g and h illustrate the mean (± SD; n=9) number of proliferating Müller glia/MPGCs per field of view (14,400 μm2). The histogram in c illustrates the mean (± SD; n=6) percentage of Sox9-positive nuclei in the INL and ONL that are BrdU-positive. The histograms in d illustrates the mean (± SD; n=9) number of proliferating NIRG cells per field of view (14,400 μm2). e; β-catenin in the nuclei of Sox9+ Müller glia/MGPCs on a 70% grayscale background. Arrows indicate the nuclei of Müller glia and or MGPCs, and hollow arrow-heads indicate nuclei of proliferating NIRG cells. Histograms f illustrates the mean (± SD; n=6) percent change in area sum and intensity sum per field of view for levels of nuclear β-catenin in the Sox9+ nuclei of Müller glia/MGPCs, and (f and i) the mean percentage of Sox9+ nuclei that are β-catenin+. Significance of difference (*p<0.05, **p<0.01) between control and treated groups was determined by using a paired, two-tailed t test. The scale bars in a, e and j represent 50 μm. Abbreviations: ONL – outer nuclear layer, INL – inner nuclear layer, IPL – inner plexiform layer, GCL – ganglion cell layer.