. 2016 May 31;23(2):63–77. doi: 10.11005/jbm.2016.23.2.63

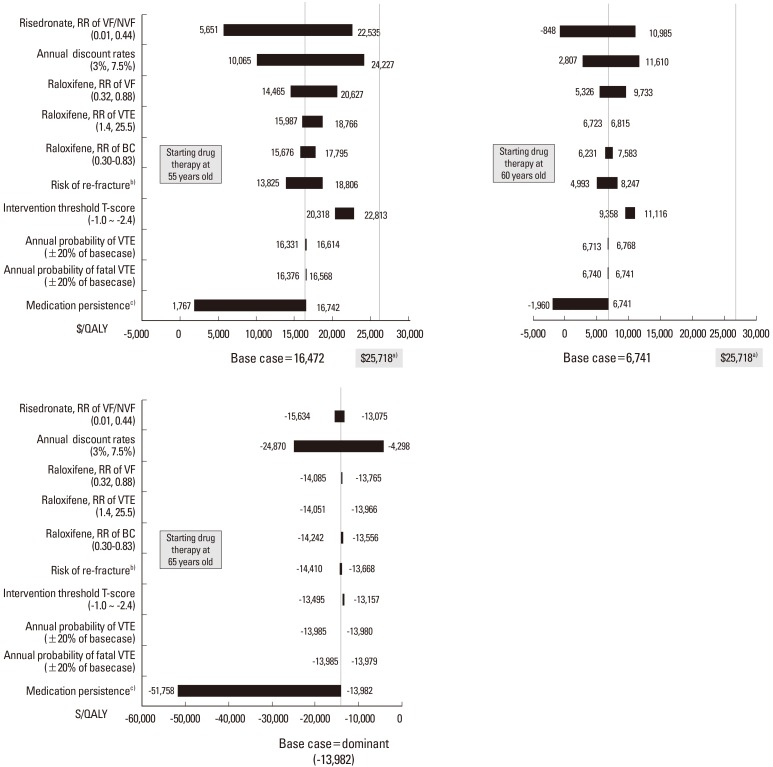
Fig. 2. Tornado diagram of the one-way sensitivity analysis. For the sensitivity analysis, the incremental cost-effectiveness ratio in terms of the cost in United States dollars per quality-adjusted life year gained was computed for each parameter's value range, and they were compared with the willingness-to-pay threshold, which was defined as the per-capita gross domestic product in Korea in 2014 ($25,718). a)per-capita gross domestic product in Korea in 2014. b)upper bound, lower bound of 95% confidence interval for each type of fracture. c)base case (100%) vs. 54% (raloxifene) and 53% (risedronate) for year 1, 38% (raloxifene) and 34% (risedronate) for year 2, and 32% (raloxifene) and 20% (risedronate) for years 3 to 5. RR, relative risk; VF, vertebral fracture; NVF, non-vertebral fracture; BC, breast cancer; VTE, venous thromboembolism; CI, confidence interval; Fx, fracture; QALY, quality-adjusted life year.

Fig. 2