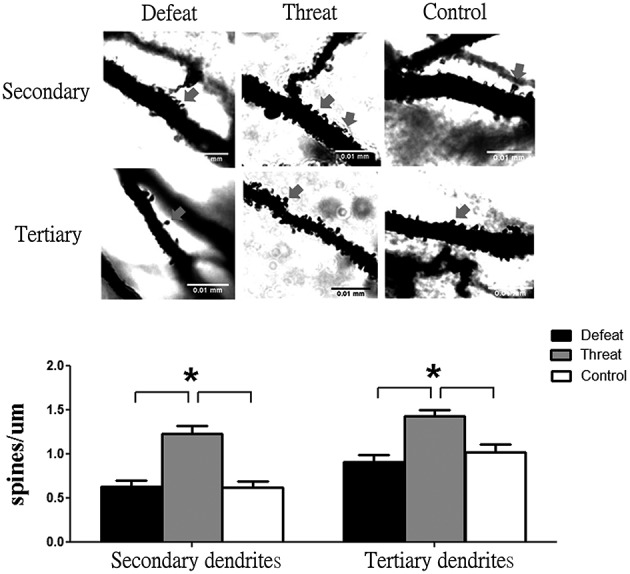
Figure 5.

Representative images and spine densities of CA1 pyramidal neurons in the three groups (batch #3) after experiencing nine social interaction trials across the entire juvenile period in Experiment 6. A total of 15 segments in the target region were scored and averaged for each group. Scale bar = 0.01 mm; *p < 0.05.
