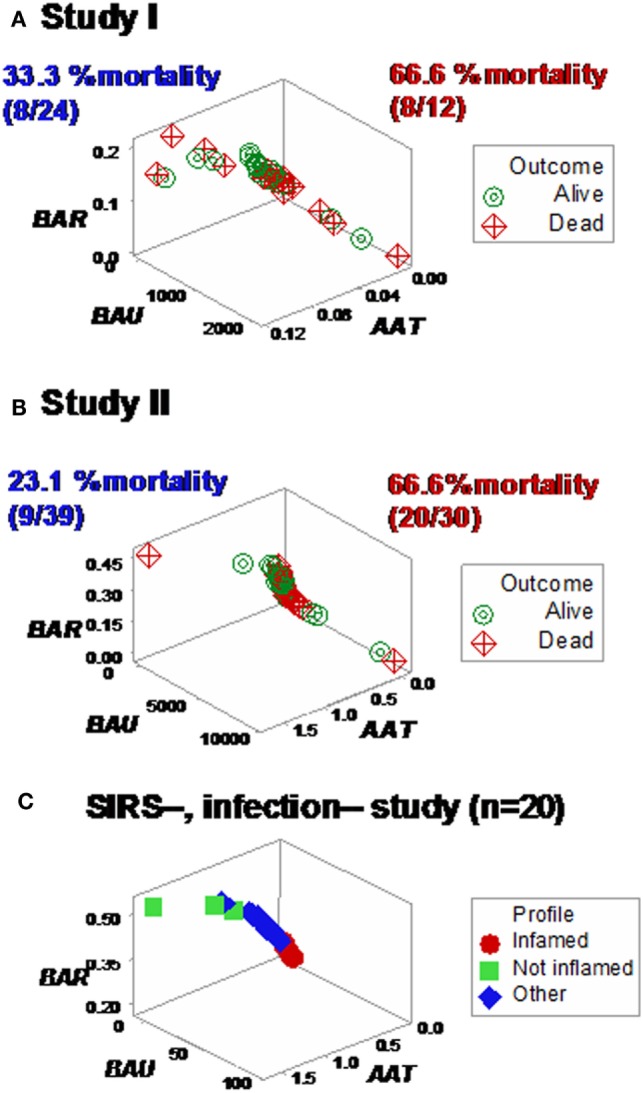
Figure 4.

Mortality rates of perpendicular data segments. Both study I (A) and II (B) displayed mortality rates at least twice higher in the subset located on the right side of the plot than in the left subset (66.6% in both studies vs. 33.3 or 23.1%, in study I or II, respectively). Such differences approached or achieved statistical significance [P = 0.057 (study I) or P ≤ 0.01 (study II), Chi-square test]. When the same data structure was utilized to analyze 20 non-infected, SIRS-negative individuals, the high-mortality subset was not observed (C), even though the scale of the critical axis (BAU) was 1000 times smaller than the scale used in (A,B); i.e., the scale facilitated the detection of any pattern, if present.
